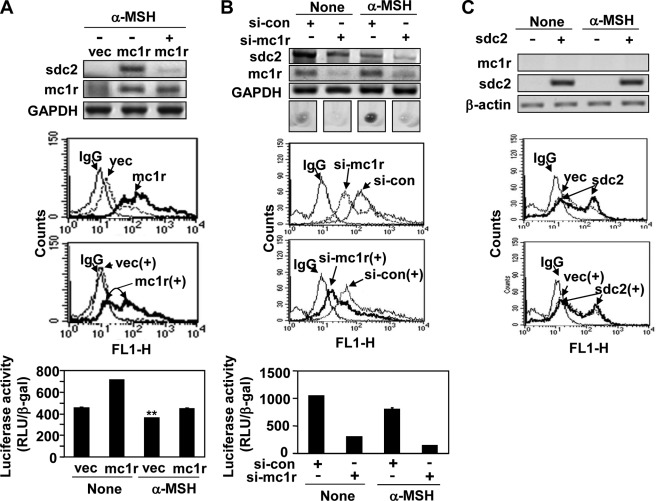
FIGURE 7.
α-MSH inhibits MC1R-mediated regulation of syndecan-2 expression in melanoma cells. A, B16F10 cells transfected with siRNA targeting MC1R (si-mc1r) were treated with α-MSH (1 μm) for 24 h. The expression levels of mRNA were analyzed by RT-PCR. GAPDH detected as the loading control (top panel). Cell surface expression of syndecan-2 (sdc2) was analyzed by flow cytometry described for Fig. 3A. The cells were treated with α-MSH (+), as was stated above. IgG was used as a control (middle panel). B16F10 cells were co-transfected with syndecan-2 reporter construct and MC1R (mc1r). The cells were treated with α-MSH (1 μm) for 24 h, and syndecan-2 promoter activity was analyzed by luciferase assay (bottom panel). **, p < 0.05 versus untreated vector (vec) cells. B, B16F10 cells transfected with siRNA targeting MC1R were treated with α-MSH (1 μm) for 24 h. The expression levels of the target mRNAs were analyzed by RT-PCR. Equal numbers of cells were harvested by centrifugation, and the cell pellets were photographed with a digital camera (top panel). The expression level of cell surface syndecan-2 was analyzed by flow cytometry (middle panel). B16F10 cells were co-transfected with syndecan-2 reporter construct and siRNA targeting MC1R (si-mc1r). The cells were treated with α-MSH (1 μm) for 24 h, and syndecan-2 promoter activity was analyzed by luciferase assay (bottom panel). C, B16G4F cells transfected with rat syndecan-2 were treated with α-MSH (1 μm) for 24 h. The expression mRNA levels of target mRNAs were analyzed by RT-PCR (top panel). Cell surface expression of syndecan-2 was analyzed by flow cytometry using anti-syndecan-2 antibody (bottom panel). si-con, control siRNA.

