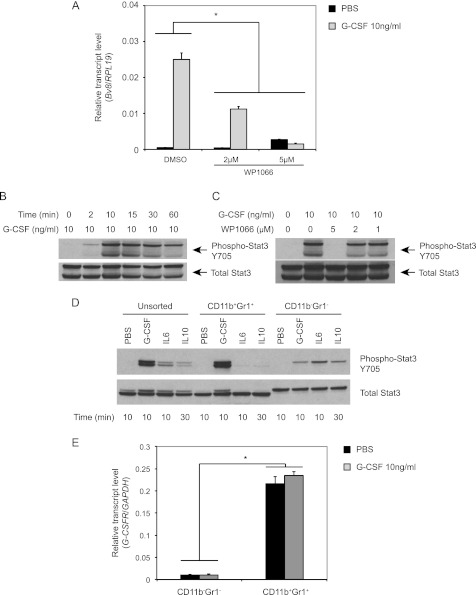
FIGURE 3.
Stat3 activation is required for G-CSF induced Bv8 up-regulation. A, Bv8 expression in bone marrow cells. Error bars represent S.E. Asterisk indicates significant difference between WP1066 and control groups (p < 0.05). B–D, Western blot analysis to detect phospho-Stat3 after G-CSF treatment for the indicated time points (B), after treatment with 1, 2, or 5 μm WP1066 for 1 h followed by incubation with G-CSF for another 10 min (C), or in unsorted, CD11b+ Gr1+, and CD11b− Gr1− cells after treatment with G-CSF, IL6, and IL10 as indicated (D). E, G-CSFR expression in CD11b+ Gr1+ and CD11b− Gr1− cells after incubation with G-CSF or PBS for 4 h. Error bars represent S.E. Asterisk indicates significant difference in G-CSFR expression between the two cell subsets (p < 0.05). Data shown are representative of three independent experiments.

