FIGURE 5.
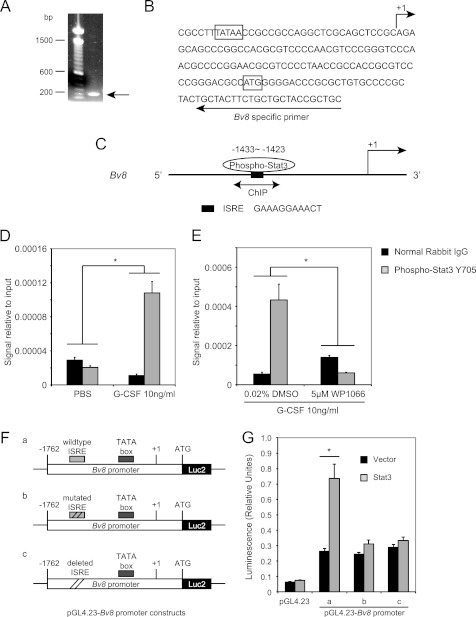
Bv8 is a direct transcriptional target of Stat3. A, agarose gel electrophoresis of the PCR product obtained from the 5′-RACE procedure. B, sequence of the mouse Bv8 gene around the translation start codon region. The arrow above the sequence indicates the transcription start site. The arrow below the sequence indicates the mouse Bv8-specific primer used for 5′-RACE. The translation start codon ATG and the TATA box are boxed. C, schematic diagram of Stat3 binding site within the proximal promoter region of the Bv8 gene. The bidirectional arrows mark the target regions for ChIP assays. D, G-CSF significantly induces the binding of phopho-Stat3 to the putative Stat3 binding site in the Bv8 promoter region. ChIPs were performed in bone marrow cells as described under “Experimental Procedures.” Error bars represent S.E. Asterisk indicates significant difference between G-CSF- and PBS-treated groups (p < 0.05). E, binding of phospho-Stat3 to the Bv8 promoter region following G-CSF treatment was blocked by pretreatment with 5 μm WP1066. Error bars represent S.E. Asterisk indicates significant difference between WP1066- and DMSO-treated groups (p < 0.05). The amount of immunoprecipitated DNA in each sample is represented as signal relative to the total amount of input chromatin, which is equivalent to one. F, schematic diagrams of the pGL4.23-Bv8 constructs, containing wild type ISRE (a), mutated ISRE (b), and deleted ISRE (c) binding site. G, Dual-Luciferase assay to investigate the role of phospho-Stat3 ISRE site in regulating mouse Bv8 promoter activity. Error bars represent S.E. Asterisk indicates significant difference between Stat3 ORF- and control vector-transfected groups (p < 0.05).

