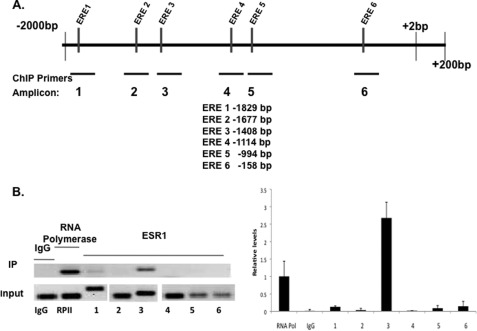
FIGURE 4.
Recruitment of ESR1 to the Fra-1 promoter. A, schematic representation of the potential ESR1 binding sites in Fra-1 gene (GenBank Accession No. AF017128). Putative EREs in the Fra-1 promoter region were determined by in silico analysis of the proximal promoter region (−1 to −2000 bp) using Consite and TESS software. Primers were designed to amplify specific regions containing ERE-like sequences, which exhibited variations of 2–3 bases from the consensus EREs. In ChIP, using ESR1 antibody, the candidate ESR1 binding sites are located at −1829 bp (ERE 1), −1677 bp (ERE 2), −1408 bp (ERE 3), −1114 bp (ERE 4), −994 bp (ERE 5), −158 bp (ERE 6), and the corresponding PCR amplicons, flanking each potential binding site, are amplicon 1 (−1964 to −1729), amplicon 2 (−1694 to −1505), amplicon 3 (−1523 to −1373), amplicon 4 (−1204 to −1050), amplicon 5 (−1071 to −931), and amplicon 6 (−275 to −118). In ChIP using RNA polymerase II antibody, RNA polymerase II binding was assessed using a primer set flanking the transcription initiation site. B, mouse primary stromal cells were cultured in the presence of P for 24 h, fixed with formaldehyde, and subjected to ChIP analysis. Immunoprecipitation (IP) was performed using the ESR1 antibody. IP with RNA polymerase II and IgG antibodies was used as the positive and negative control, respectively. The immunoprecipitated DNA fragments were recovered and amplified by PCR (32 cycles) using indicated primer pairs for each amplicon (upper). The input lane represents 1% of each soluble chromatin. IP lane represents the amplified PCR product for each amplicon. Relative levels of recruitment at various sites of the Fra-1 promoter were determined by real-time PCR and normalized to input DNA and RNAP II values. The data shown are representative of three independent experiments. Error bars, S.E.

