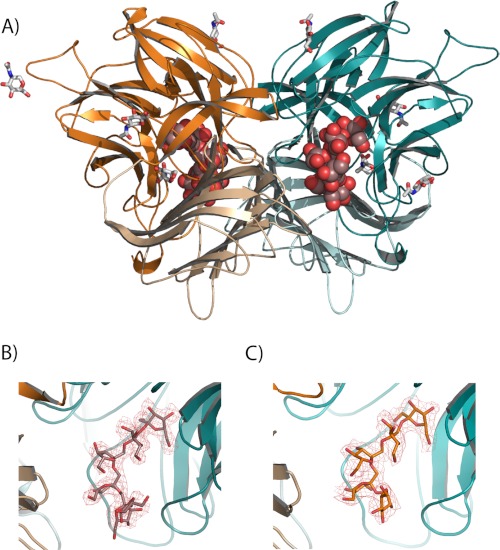
FIGURE 2.
Structure of the Ffase complexes. A, overall structure of Ffase dimer is represented in ribbon diagram, with two inulin chains found in the D50A crystals represented as spheres and the glycosylation units represented as sticks. Each subunit (cyan and orange) is bimodular and consists of a catalytic β-propeller domain (dark) and a C-terminal β-sandwich domain (light). B and C, close-up view of D50A-inulin (B) and E230A-fructosylnystose (C) complex binding sites. The colored portion of the 2Fo − Fc electron density map at 2.2 Å covering the inulin (B) and 2.7 Å covering the oligosaccharide (C) is contoured at 1.0 σ level.

