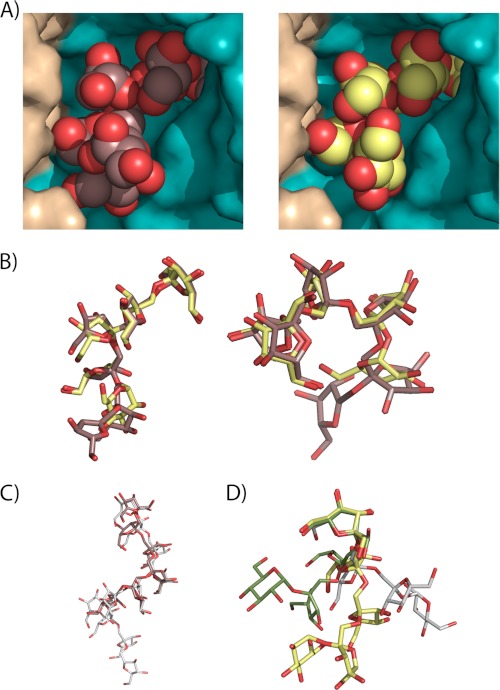
FIGURE 3.
The conformation of the substrates at the Ffase active site. A, close-up view of the Ffase active site showing the catalytic domain of one subunit colored in cyan and the C-terminal β-sandwich domain of the adjacent subunit in beige. The six units of inulin (left) and fructosylnystose (right) molecules found in the Ffase inactivated mutants are represented as spheres. B, inulin (brown) and fructosylnystose (lime green) moieties, in stick representation, are superimposed in two perpendicular views to highlight the fact that both substrates adopt the same conformation at the Ffase active site. C, inulin found at the D50A crystal (brown) is compared with inulin found in its free crystalline state (white). D, fructosylnystose found in the Glu-230 crystal (lime green) is superimposed on nystose found in the A. japonicus fructosyltransferase complex (green) and crystallized free nystose (white), showing that they adopt very different conformations.

