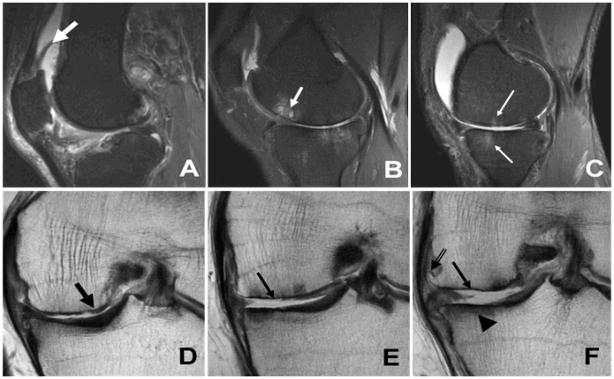
Figure 1.
Sagittal inversion recovery (A–C) and coronal fast spin echo (D–F) images illustrating the magnetic resonance imaging findings of osteoarthritis. (A) reactive synovitis (thick white arrow), (B) subchondral cyst formation (white arrow), (C) bone marrow edema (thin white arrows), (D) partial thickness cartilage wear (thick black arrow), (E–F) full thickness cartilage wear (thin black arrows), subchondral sclerosis (arrowhead) and marginal osteophyte formation (double arrow). Image courtesy of Drs. Hollis Potter and Catherine Hayter, Hospital for Special Surgery, New York, NY

