
Figure 2.
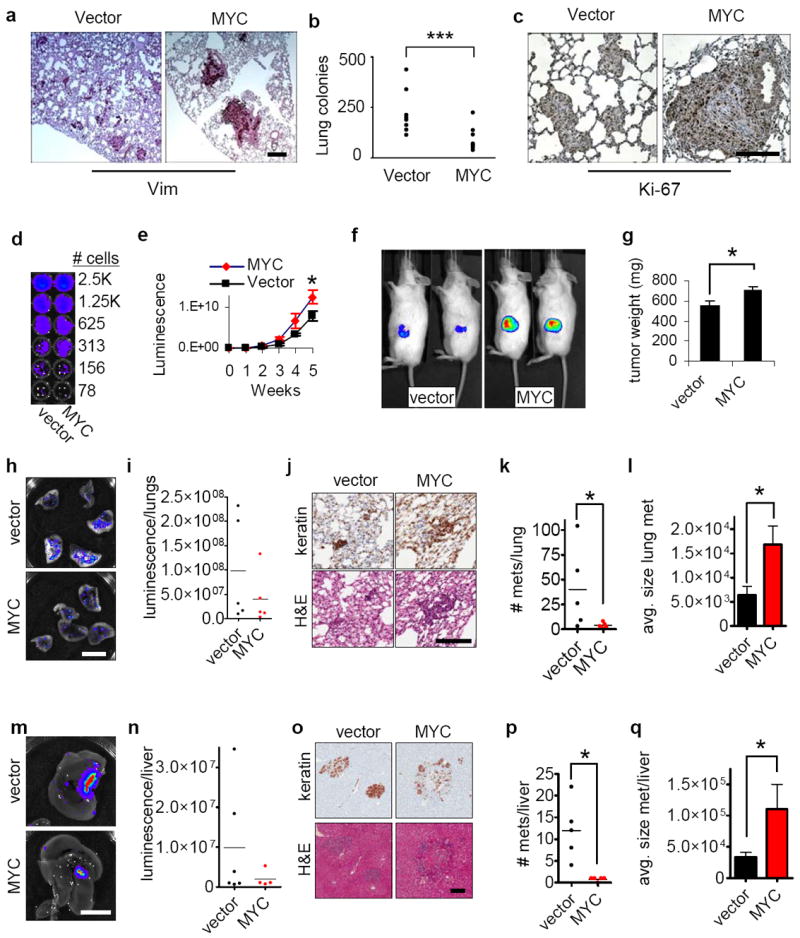
Elevated MYC expression inhibits metastasis of human breast cancer cells. (a-c) Over-expression of MYC significantly decreases lung metastases of breast cancer cells. MDA-MB-231 cells stably expressing vector or ectopic MYC were injected into nude mice through the tail vein and lung metastases were assessed 6 weeks after injection. Sections of the lungs were stained with antibody against human vimentin (a) and quantification revealed that MYC significantly reduced lung metastasis (b, n=9, p<0.0049). Assessment of Ki-67 (c) revealed increased proliferation in the MYC-expressing cells. Scale bars: 200 μm. (d) Luminescence detection shows comparable luminescence per cell for both vector and MYC over-expressing cells. (e) MYC-expressing cells show more rapid growth at the primary tumor site, assessed by quantitative in vivo imaging (n=5 for each group). (f) Sample images from in vivo imaging of primary tumors for vector and MYC (week 6). (g) Increased size of primary tumors from MYC-expressing cells (week 6; n=5 for each group). (h-i) Decreased metastatic burden in lungs of mice implanted with MYC-expressing cells, assessed by luminescence (week 6; h, sample images, scale bar 1 cm; i, quantification of lung luminescence; n=5 for each group; differences between cells expressing vector alone and those expressing MYC were not statistically significant). (j) Images of lung metastases, stained for human cytokeratins (top), and with H&E (bottom). scale bar=200 μm. (k-l) Quantification of number (k) and size (l) of lung metastases indicates that MYC cells form much fewer metastases but grow to larger size (n=5 for each group). (m-n) Decreased metastatic burden in livers of mice implanted with MYC-expressing cells (week 6; m, sample images, scale bar 1 cm; n, quantification of liver luminescence; differences between conditions were not statistically significant; n=6 for vector, n=5 for MYC). (o) Images of liver metastases, stained for human cytokeratins (top), and with H&E (bottom). Scale bar=200 μm. (q-r) Quantification of number (p) and size (q) of liver metastases indicates that MYC-expressing cells form fewer metastases that grow to larger size (n=5 for each group). Results are expressed as mean± SEM. *, p<0.05; **, p<0.01; ***, p<0.005.