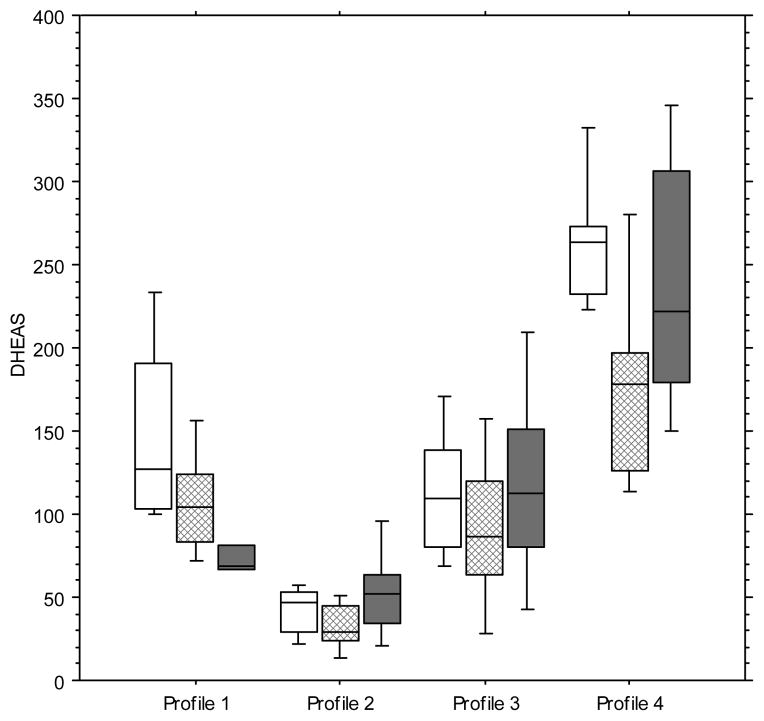
FIG. 1.
Serum DHEAS patterns for the selected study cohort. Reference profile 1 (n = 30) depicts the mean and range of DHEAS at baseline with the classical anticipated continued decline from year 0 (open boxes) to year 1 (hatched boxes) and year 2 (solid boxes). Profiles 2 (selected to represent the baseline mean of >1 SD below the x̄ of reference DHEAS with a subsequent increase; n = 30), 3 (at the x̄ of reference DHEAS; n = 30), and 4 (>1 SD above the x̄ of the reference DHEAS with an immediate decline and recovery; n = 30) illustrate the samples in which there was the transitory fall and then rise, a profile that has been uniquely reported in SWAN enrollees. Boxes represent the SEM and bars the range. DHEAS, dehydroepiandrosterone sulfate.

