Figure 1.
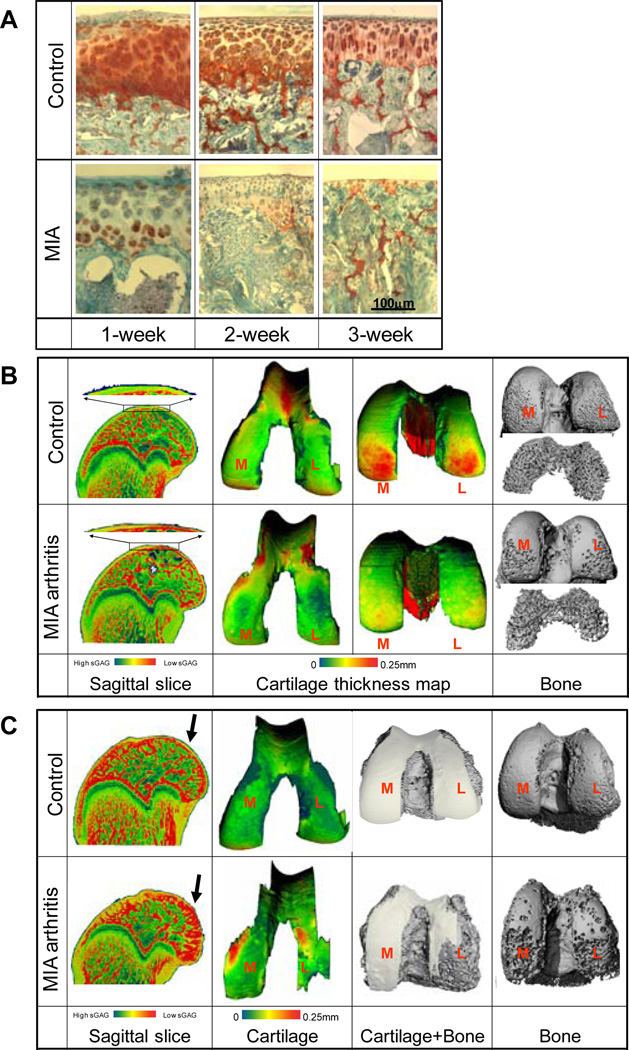
A: Representative safranin-O stained sagittal sections of femoral articular cartilage in saline control and MIA-injected knees at 1, 2, and 3 weeks post-injection. B-C: EPIC-µCT images of cartilage X-ray attenuation (sagittal slices), cartilage thickness maps, and standard µCT images of subchondral and trabecular bone in distal femora at 1 week (B) and 3 weeks (C) after injections of MIA to induce OA and saline for contralateral controls.

