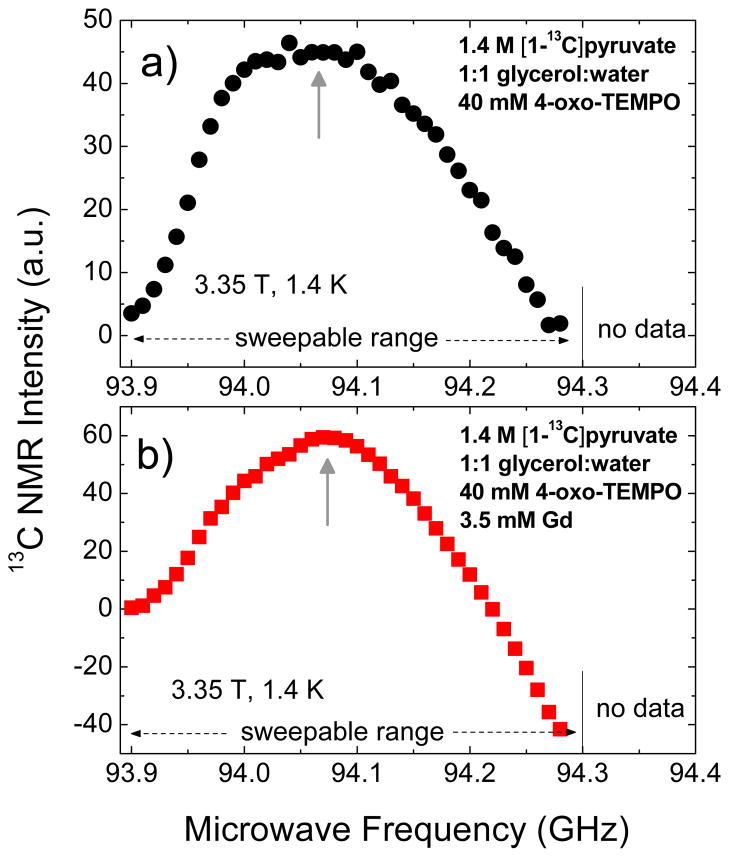
Figure 7.
Microwave DNP spectra of 100 μL samples of 1.4 M [1-13C]pyruvate in 1:1 (v/v) glycerol:water doped with a) 40 mM 4- oxo-TEMPO and b) 40 mM 4-oxo-TEMPO and 3.5 mM Gd3+. These data were taken in the HyperSense at 3.35 T and 1.4 K using a 100 mW microwave source. The up arrows indicate the approximate location of the positive polarization peak. Due to the limited microwave frequency range of the source, measurement at frequency ωe>94.30 GHz, where the negative polarization peak is located, is not accessible.

