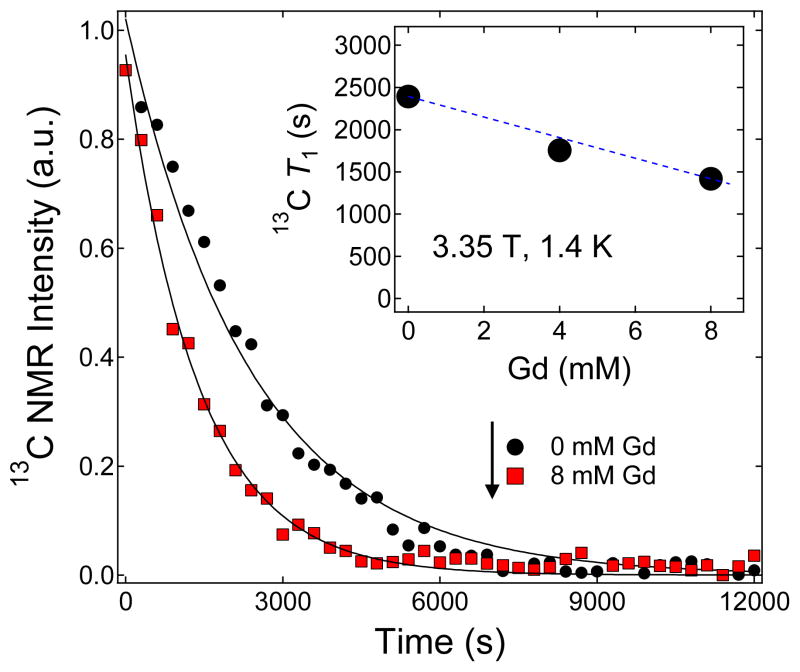
Figure 9.
Representative decay curves of the hyperpolarized solid-state NMR signal of 100 μL TEMPO-doped samples (1.4 M [1-13C]pyruvate in 1:1 (v/v) glycerol:water doped with 40 mM 4-oxo-TEMPO) mixed with different concentrations of Gd3+. The experiments were performed after the samples achieved maximum polarization level and the microwave source was turned off. Inset: Summary of the 13C solid-state T1 values extracted from the decay curves versus different Gd3+ concentrations.

