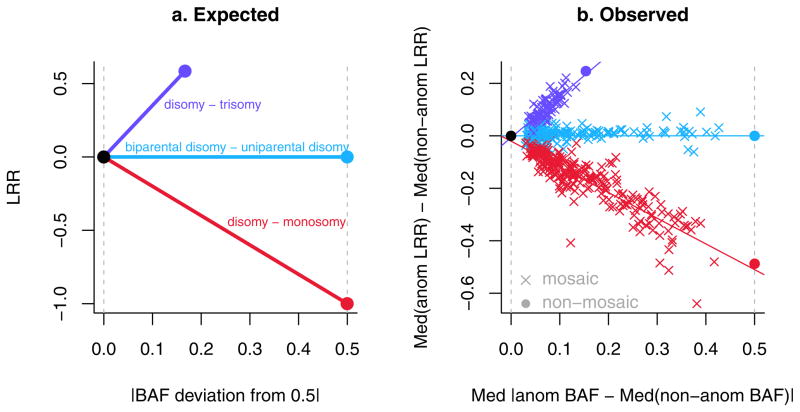
Figure 2.
Expected and observed values of B Allele Frequency (BAF) and Log R Ratio (LRR) metrics for clonal mosaic anomalies detected in GENEVA subjects. (a) Expected. (b) Observed (N=514). In (b), “med”=median, “anom”=within the anomaly, “nonanom”=non-anomalous autosomal regions of the same sample. The solid purple and red circles represent the mean values of non-mosaic anomalies and the solid black and cyan circles are theoretical.

