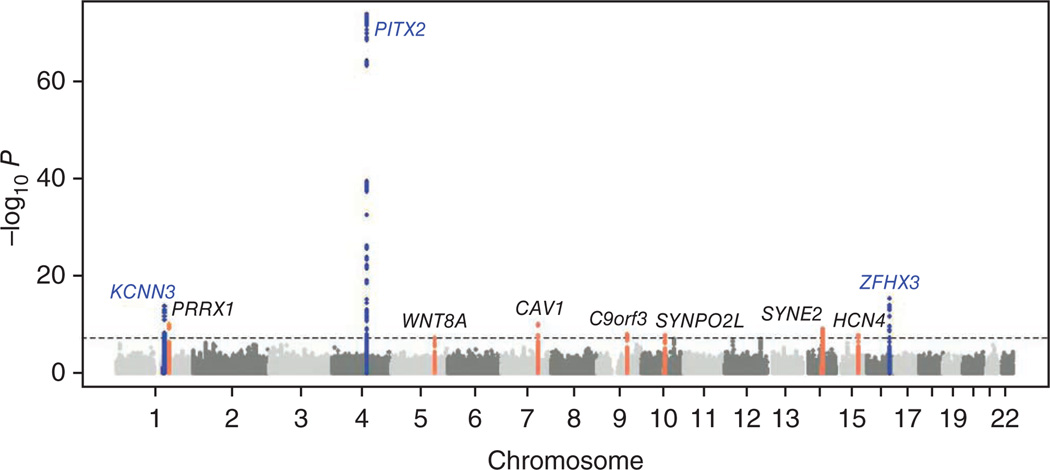
Figure 1.
Manhattan plot of meta-analysis results for genome-wide association with atrial fibrillation. The −log10 (P value) is plotted against the physical position of each SNP on each chromosome. The threshold for genome-wide significance, P < 5 × 10⁻⁸, is indicated by the dashed line. The three previously reported loci for atrial fibrillation are indicated in blue, and the seven new loci that exceeded the genome-wide significance threshold are indicated in orange.

