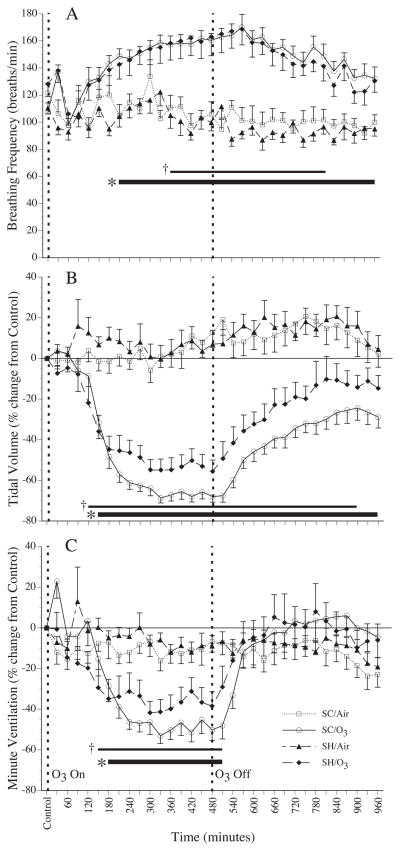
Figure 3.
Mean breathing frequency (A), percent change in estimated tidal volume (B), and percent change in estimated minute ventilation (C) in Brown-Norway rats that were sensitized and challenged with nDer f 1 (SC, n=10) or sham treated with saline (SH, n=11) during 8 hours of exposure to 1.0 ppm ozone (O3) or filtered air (Air) that was followed by an 8 eight hour period in Air. Each point is a 30 minute average. * indicate a significant difference (p ≤ 0.05) between O3 and Air within SC and SH groups. † indicate a significant difference (p ≤ 0.05) between SC and SH groups exposed to O3. Values are mean ± sem.

