Figure 6.
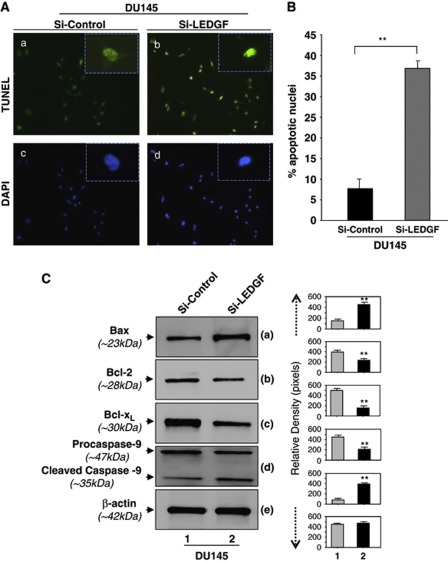
LEDGF depletion promotes apoptosis in DU145 cells. (A) Determination of apoptosis in scrambled Si-Control- or Si-LEDGF-transfected cells by TUNEL staining. Images were taken in FITC (a versus b) and DAPI (c versus d) filters by fluorescent microscope equipped with camera (A) (Nikon Eclipse Ti-U fluorescent microscope). The number of apoptotic nuclei was counted manually. Three randomly selected fields were taken to quantify the apoptotic cells, and percentage was calculated and is shown as histogram (B, black bar versus gray bar). Data represent the mean±S.D. from three independent experiments (**P<0.001). (C) Representative images of western analysis for apoptotic signaling-related proteins (Bax, Bcl2, Bcl-xL, procaspase 9 and cleaved caspase 9). Lower panel shows β-actin band as internal control. Each band of blot was quantified using densitometer shown on the right (compare gray bar versus black bar)

