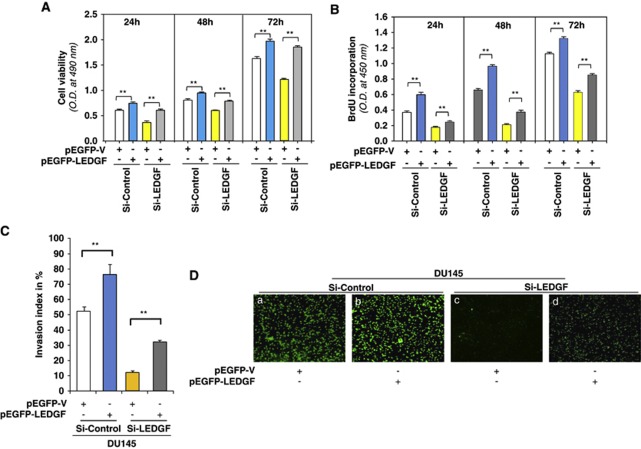
Figure 8.
Re-overexpression of LEDGF in LEDGF knockdown Si-LEDGF-DU145 cells restored viability, proliferation and invasive behavior of DU145 cells. (A) Si-Control and Si-LEDGF cells were overexpressed with LEDGF. MTS assay was performed at 24, 48 and 72 h and results are presented as histogram. (B) Si-Control and Si-LEDGF cells were overexpressed with LEDGF. BrdU incorporation assay was performed at 24, 48 and 72 h and results are presented as histogram. (C) Histogram showing the percentage of invasion index after overexpression with LEDGF in Si-Control and Si-LEDGF cells (re-expressed) (yellow bar versus gray bar). (D) Photomicrographs of CyQuant GR-stained membrane with invaded cells shown (a and b, Si-Control; c and d, Si-LEDGF). Images are of representatives from three independent experiments. Left panel shows the quantitative measurements of migration index (black bar versus gray bar). Data represent the mean±S.D. from three independent experiments (**P<0.001)

