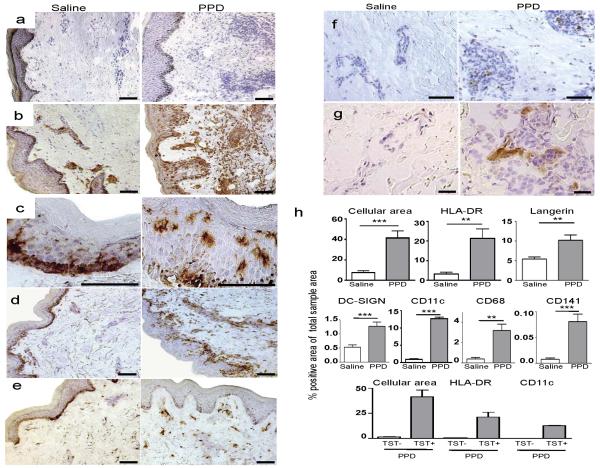
Figure 1. PPD-injected sites show increased cellularity and infiltration of DC.
Cryosections of donor-matched skin punch biopsies of the TST site were taken 48 hours post-injection. Representative images are shown of saline injected versus PPD injected sites from TST+ donors. Increased cellularity (a) as measured by cell nuclei counterstained blue with hematoxylin, and increased expression (brown) of HLA-DR (b), Langerin (c), DC-SIGN (d), CD11c (e), CD68 (f) and CD141/BDCA-3 (g) at the TST site. All scale bars = 25μm. Note that the dark basal membrane represents melanin-rich cells and not positive staining. (h) Bar graphs show mean ± SEM. Data collected from image analysis of dermis only, except for Langerin where epidermis only was analyzed.

