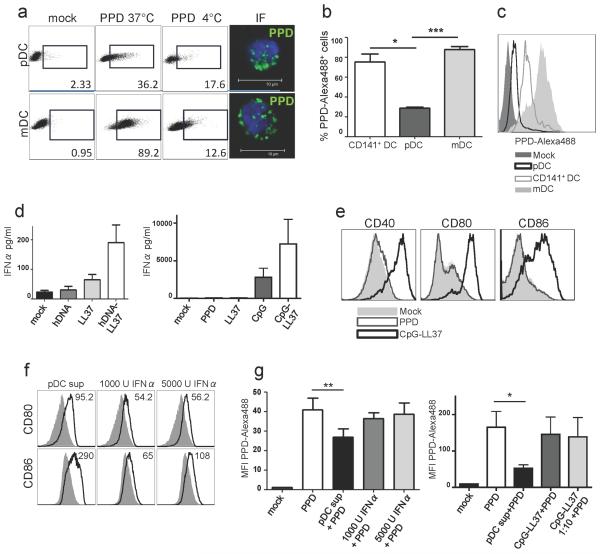
Figure 4. LL37/DNA-activated pDC affect mDC phenotype and function.
(a) Gates indicate percentages of cells with binding (4°C) and/or uptake (37°C) of PPD-Alexa488. Single plane confocal images show intracellular PPD-Alexa488 in DC pulsed at 37°C. (b) Bar graph shows mean ± SEM of mean fluorescence intensity values (MFI) of PPD-Alexa488 uptake, n=3 (c) Representative histogram of the PPD uptake. (d) IFNα production of pDC exposed to complexes of LL37 and human or CpG DNA. (e) Phenotypic maturation of pDC exposed to LL37-DNA. (f) Phenotypic maturation in mDC exposed overnight to supernatants from stimulated pDC. Solid grey lines represent unexposed mDC. Numbers indicate MFI. (g) mDC pulsed with PPD-Alexa488 for 2 hours after overnight stimulation.

