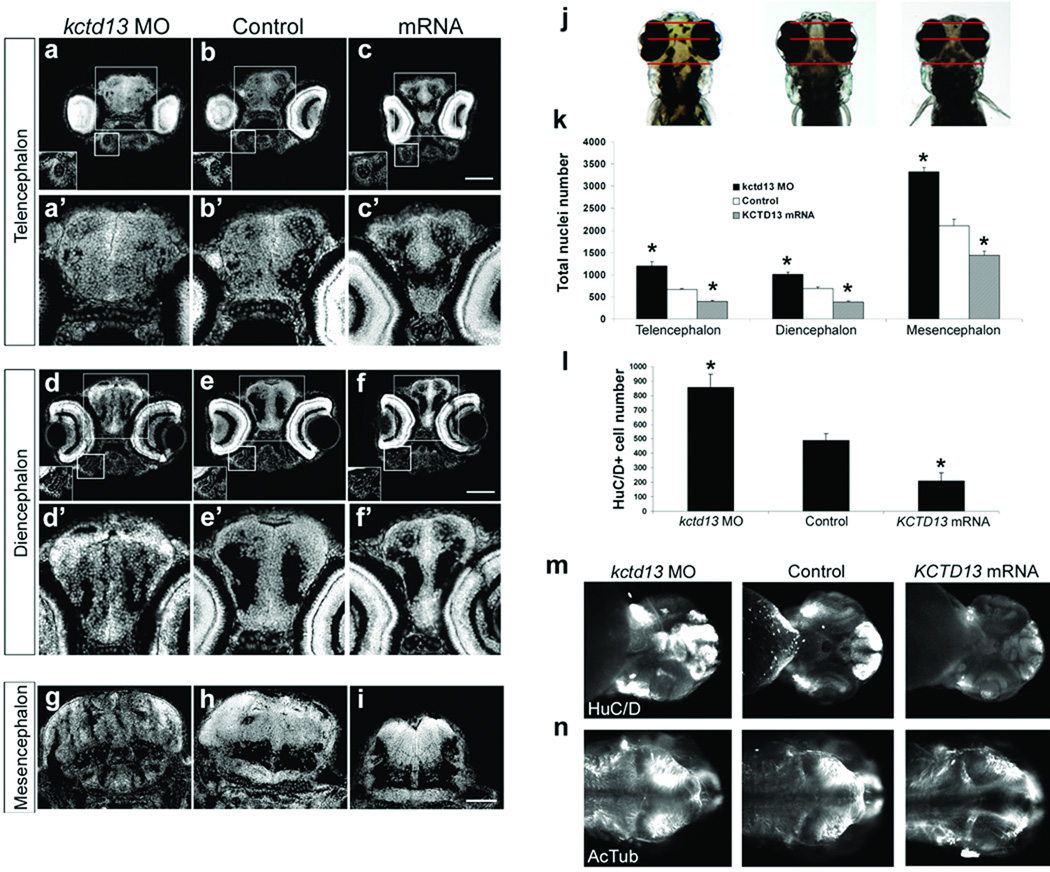
Figure 3. KCTD13 dosage changes lead to neuroanatomical defects.
DAPI staining on transverse sections of the telencephalon (a, b, c), the diencephalon (d, e, f), and the mesencephalon (g, h, i) of embryos injected with kctd13 MO, control or KCTD13 mRNA at 4.5 dpf. (j) The planes of section are illustrated with red lines on dorsal views of kctd13 MO-, control-, and KCTD13 mRNA-injected embryos (left to right). Higher magnifications of the telencephalon (a–c) and the diencephalon (d–f) are in (a’–f’). The Meckel pharyngeal cartilage (a–c) and the palatoquadrate pharyngeal cartilage (d–f) are in insets. Scale bar, 100µm. (k) Bar graph of the total number of nuclei for the three classes of embryos in the telencephalon, diencephalon and mesencephalon at 4.5 dpf (3 adjacent sections, n=4). (l) Bar graph of the number of HuC/D positive cells in the telencephalon for kctd13 MO-, control- and KCTD13 mRNA-injected embryos at 4.5 dpf (3 adjacent sections, n=4). (m) Ventral and (n) dorsal views of kctd13 MO-, control-, and KCTD13 mRNA-injected embryos at 2 dpf (left to right). Data are represented as mean ± s.d. * p<0.01; two-tailed t-test comparisons between control and either MO- and mRNA-injected embryos.

