Figure 4.
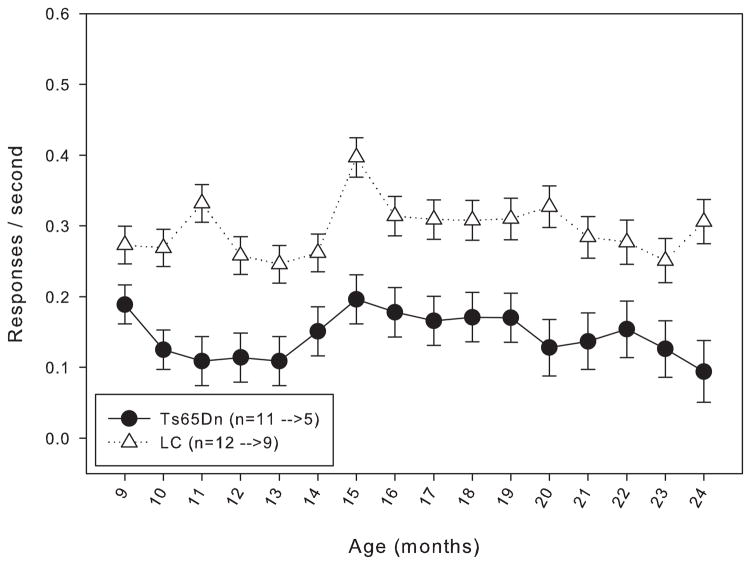
Top panel: rate of responding for Group 1 mice from 9 to 24 months of age. Each data point represents the mean ± S.E. There was a significant overall effect between the two lines (F(1,15)=9.469, p<0.05), as well as a significant effect between the months (F(1,15)=1.838, p<0.05); there was not a significant interaction between line and month (F(1,15)=0.761, p>0.05). The values for the n in the legend indicate the number of animals included in the data points at 9 months of age before the arrow, and the number of animals included in the data points at 24 months of age after the arrow.
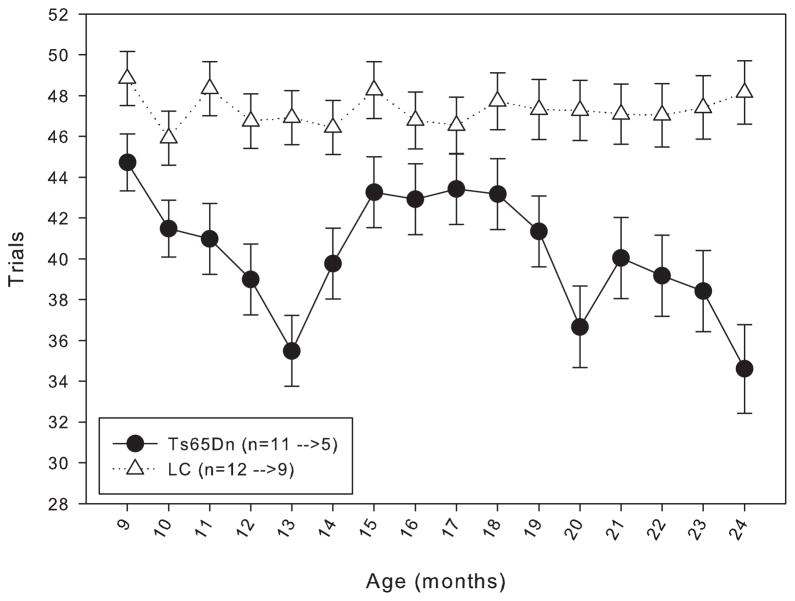
Bottom panel: number of trials completed for Group 1 mice from 9 to 24 months of age. Each data point represents the mean ± S.E. There was a significant overall effect between the two lines (F(1,15)=6.956, p<0.05), as well as a significant effect between the months (F(1,15)=2.089, p<0.05); there was not a significant interaction between line and month (F(1,15)=1.649, p>0.05). The values for the n in the legend indicate the number of animals included in the data points at 9 months of age before the arrow, and the number of animals included in the data points at 24 months of age after the arrow.


