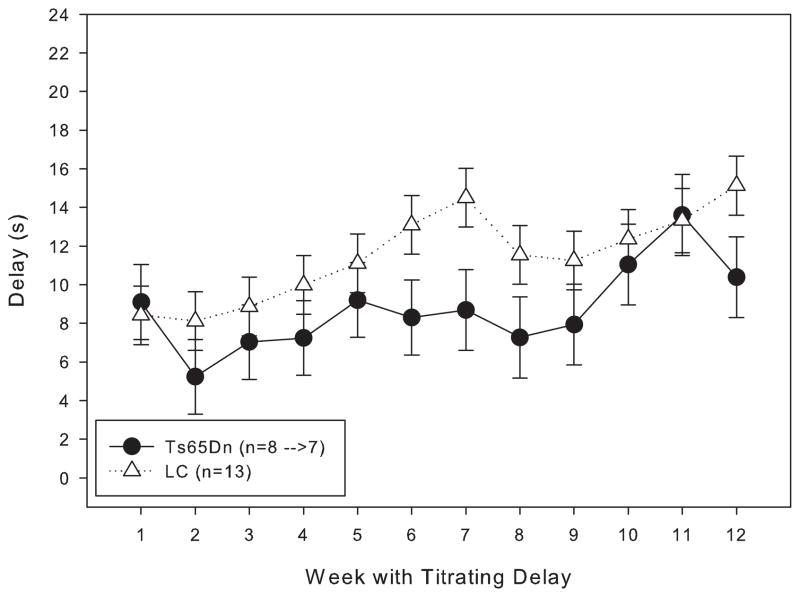
Figure 6.
Length of the mean delay per session for Group 2 mice for the first 12 weeks under the titrating schedule. Each data point represents the mean ± S.E. There was not a significant overall effect between the two lines (F(1,11)=2.141, p>0.05), while there was a significant effect between the weeks (F(1,11)=2.479, p<0.05); there was not a significant interaction between line and week (F(1,11)=0.630, p>0.05). The values for the n in the legend indicate the number of animals available at the first week of titration before the arrow, and the number of animals available by week 12 of titration after the arrow.

