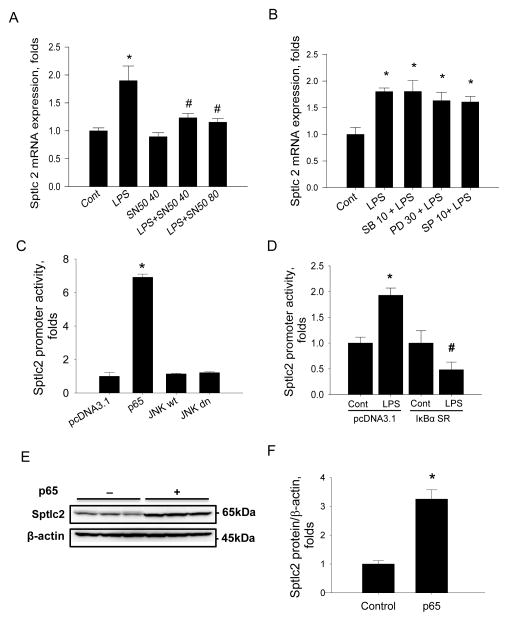
Figure 5.
Involvement of inflammatory response pathways in regulation of Sptlc2 expression by LPS in Raw264.7 cells. Cells were incubated with 40 and 80 μM SN50 (A) or 10 μM SB203580 (SB), 30 μM PD98059 (PD), 10 μM SP600125 (SP) (B) respectively in the presence or absence of 1 μg/ml LPS for 8 hrs. Expression of Sptlc2 was measured by RT-PCR. pGL3 reporter construct containing Sptlc2 promoter (-2049~-54) was co-transfected with empty pcDNA3.1, p65, wild-type JNK (JNKwt) or dominant negative JNK (JNKdn) respectively. After 24 hrs incubation, the luciferase activity was measured by Dual-Luciferse Reporter Assay (C). After co-transfection of pcDNA3.1 empty vector or IκBα super-repressor vector (IκBα SR) with Sptlc2 reporter construct and 8 hrs incubation with 1 μM LPS, the activity of luciferase was measured (D). Raw264.7 cells were transfected with pcDNA 3.1 empty vector or pcDNA3.1-p65 vector and incubated for 24 hrs, Sptlc2 protein level were determined by immunoblot (E) and quantified by densitometry (F). Expression of Sptlc2 was normalized by β-actin. n=3, mean ± SEM, *p<0.05 vs. control, #p<0.05 vs LPS with pcDNA3.1 empty vector. Results are representative of two independent experiments.

