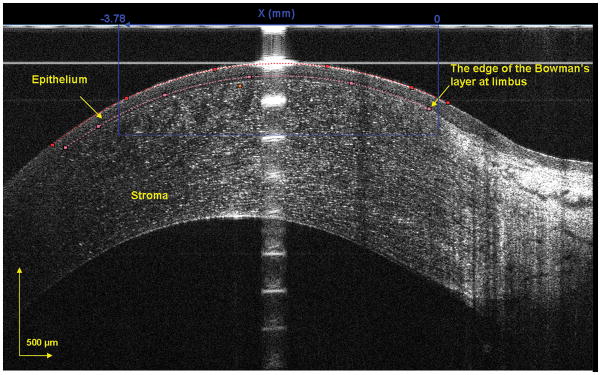
Figure 6. Baseline epithelial thickness profile.
The epithelial thickness profiles at the vertical (A – C) and horizontal (D – F) meridians were obtained by scanning different locations. Each scan consisted of 1000 lateral A-scans over a chord distance of 3.78 mm (upper scale) and was divided into 10 equal zones (lower scale). For the peripheral profiles, Zone 1 began at the edge of Bowman’s layer. Bars denote 95% confidence intervals.

