
Figure 3.
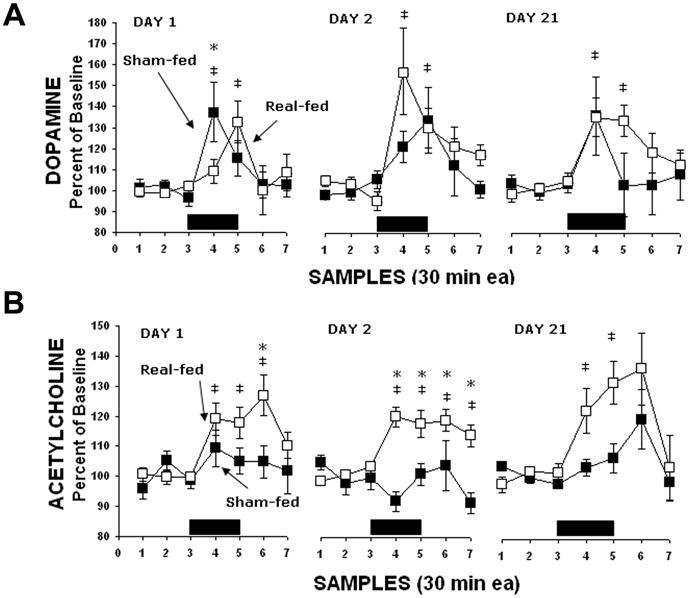
Changes in extracellular DA and ACh release in the NAc when rats are bingeing and purging via sham feeding. (A) DA release is increased in bingeing rats when both real-feeding and sham-feeding. Significant differences between groups are indicated by asterisks (P<0.05). Significant differences from baseline are indicated by ‡ (P<0.05). (B) ACh increased for real-feeding rats during sugar intake, but there was no response for sham-feeding rats during this time marked by black rectangles along the ordinate. Asterisks indicate that the ACh levels were significantly higher for the real- compared with sham-feeding rats. Differences from baseline for the real-feeding rats are indicated by ‡ (P<0.05). Figure reprinted with permission from (Avena et al., 2006b).