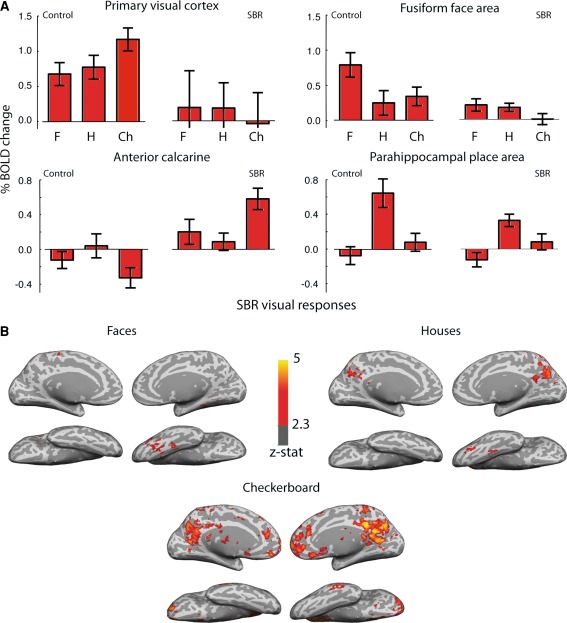
Fig. 2.
a Responses of control subjects and SBR to visual stimulation. The bar charts show the % BOLD change to faces, houses, and checkerboard compared to fixation across a range of visual cortical regions for the control group and for the blind subject SBR. Interestingly, while SBR shows the smallest response to the checkerboard in V1, it is this stimulus that evokes the greatest activation outside of V1. Error bars for control data show standard errors of the mean across the group. Error bars on SBR show within-scan variance calculated from the single scan run. b Shows the activation to visual stimuli in SBR’s brain. The greater activity in the right hemisphere suggests that his eyes were not directed to the centre of the screen. Unlike control subjects in whom the greatest activation to the checkerboard stimulus is in the occipital lobe, the visual activity to the stimulus is spread throughout the cortex in SBR

