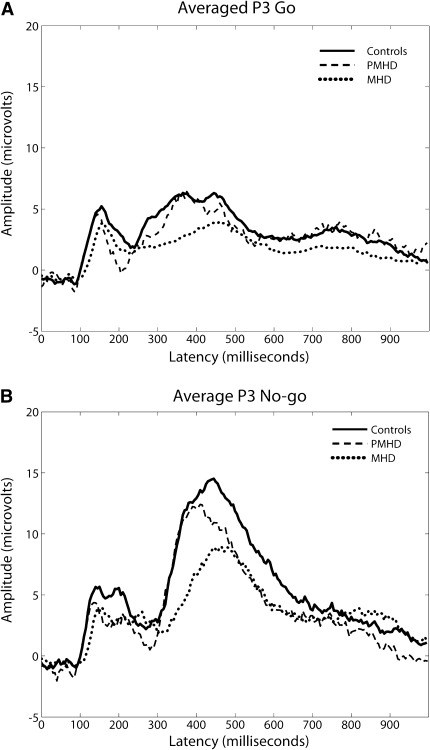
Fig. 1.
a Go P300 waves per group (averaged). Note P300 waves for the three groups during SART Go trials, averaged over the midline electrodes. Time point 0 denotes the point of stimulus presentation. b No-go P300 waves per group (averaged). Note P300 waves for the three groups during SART No-go trials, averaged over the midline electrodes. Time point 0 denotes the point of stimulus presentation

