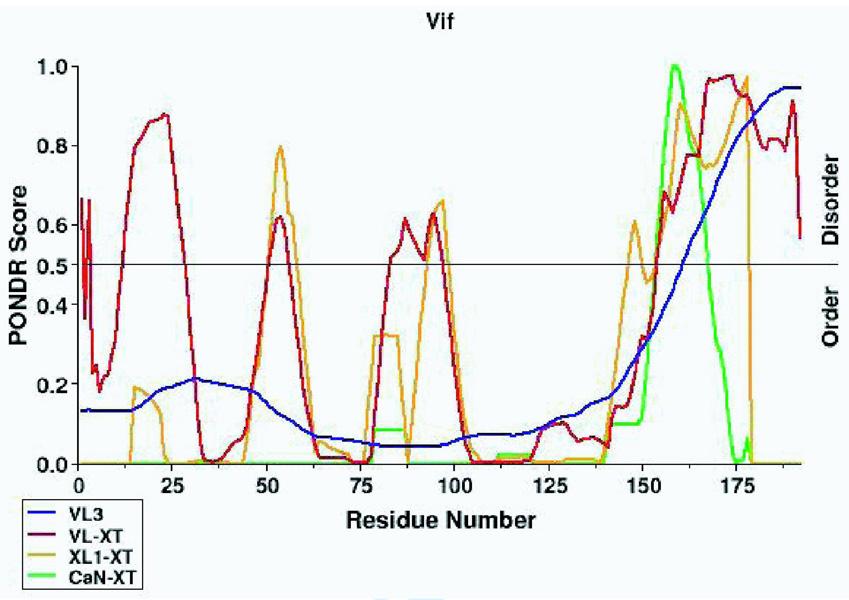
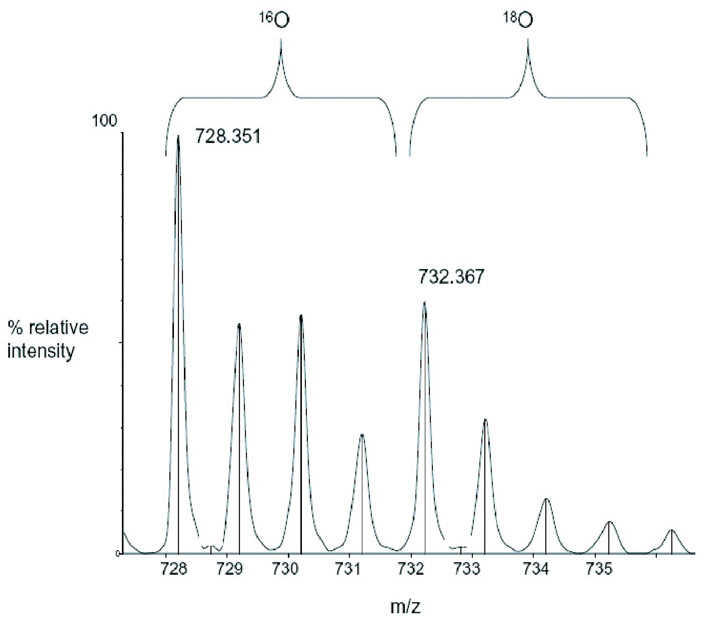
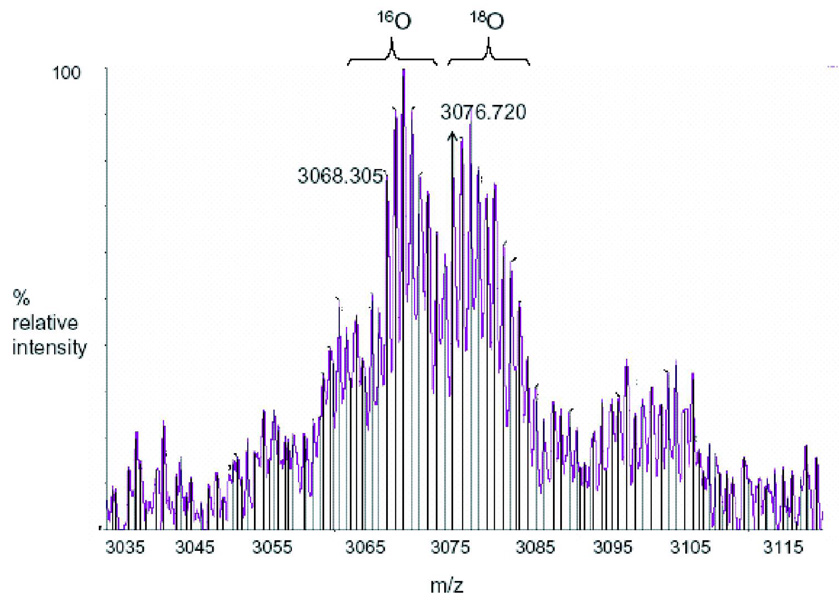
Figure 2. Analysis of HIV-1 Vif using reflectron MALDI-TOF-MS.
The mass spectrometry data presented here represents an example of the spectra of a peptide (Figure 2B) and a cross-link (Figure 2C) in Tables 1 and 2, respectively. m/z represents the mass-to-charge ratio of the ion and in the case of a singly charged ion represents the peptides MH+ (molecular weight). (A) Predicted regions of intrinsic disorder for HIV-1 Vif using PONDR®, Predictors of Natural Disordered Regions 50,51. The four colors indicate four separate predictor algorithms: blue VL3, red VL-XT, yellow XL1-XT, and green CaN-XT. (B) An unlabelled peptide at m/z 728.351 and its labeled (18O) counterpart 4Da larger at m/z 732.367. This peptide corresponds to residues 37–41 in the protein. (C) An unlabelled intermolecular cross-linked peptide at m/z 3068.305 and its labeled (18O) counterpart 8Da larger at m/z 3076.720. This region corresponds to a cross-link between peptides 51–63 and 159–173 and is only seen in the dimer and trimer. The arrow indicates the beginning of the +8 Da ion series.


