
Figure 3.
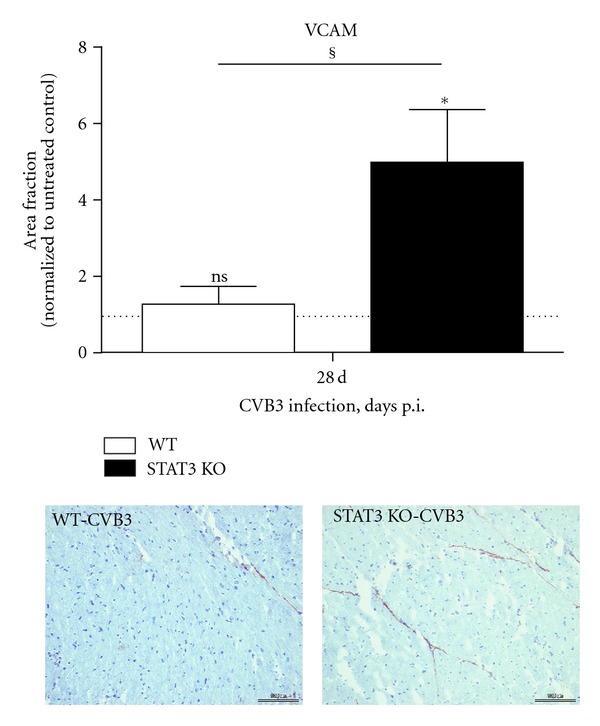
VCAM expression in cardiac tissue of CVB3 infected mice. The expression level was examined at cryosections of control or infected mice. The expression is shown as area fraction and was normalized to the corresponding untreated mice and expressed as x-fold over basal expression. *Data were compared to the expression of the corresponding untreated controls. *P < 0.05; §Data between WT and STAT3 KO mice were compared. § P < 0.05.