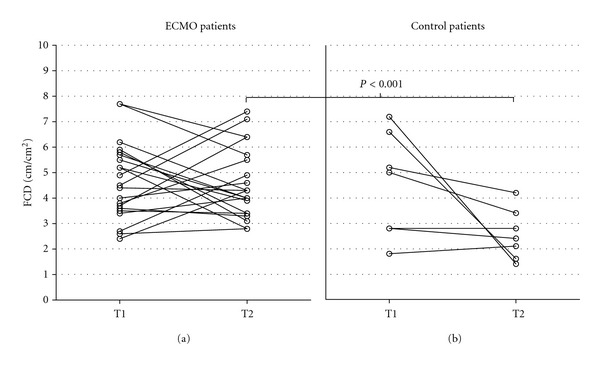
Figure 1.

Diagram showing the functional capillary density (FCD). (a): ECMO patients, (b): ventilated control patients. No difference in median FCD was seen at T1 between the two groups: 4.5 cm/cm2 (range 2.4–7.7) versus 5.0 cm/cm2 (range 1.8–7.2), P value = 0.811. At T2, FCD was higher in ECMO group than in the control group: 4.3 cm/cm2 (range 2.8–7.7) versus 2.4 cm/cm2 (range 1.4–4.2), P value <0.001.
