
Figure 2.
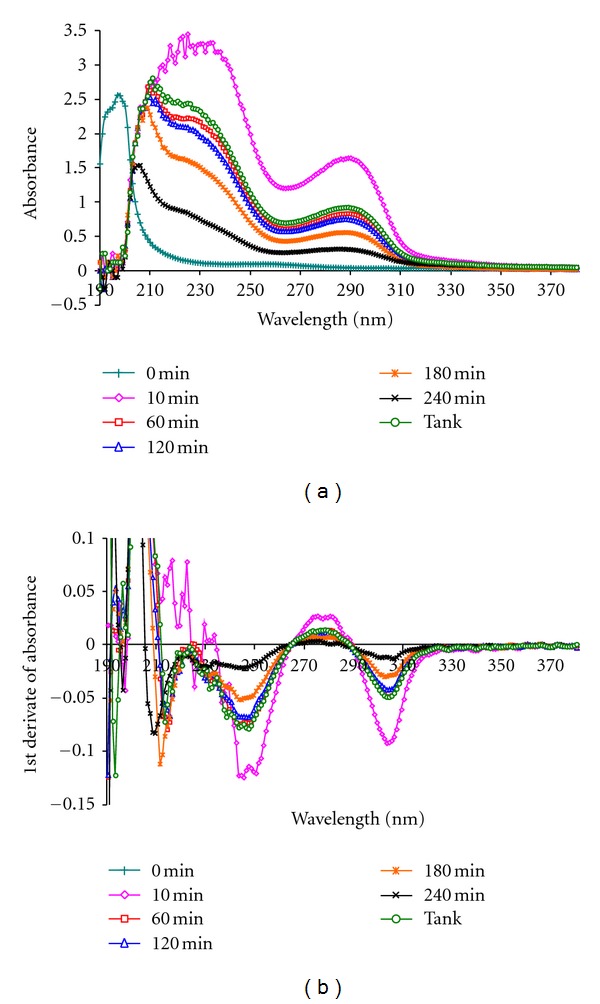
Example of absorbance spectrum (a) and first derivate of absorbance spectrum (b) obtained over wavelength range of 190–380 nm on spent dialysate samples at different times during dialysis session.
Official websites use .gov
A
.gov website belongs to an official
government organization in the United States.
Secure .gov websites use HTTPS
A lock (
) or https:// means you've safely
connected to the .gov website. Share sensitive
information only on official, secure websites.
Example of absorbance spectrum (a) and first derivate of absorbance spectrum (b) obtained over wavelength range of 190–380 nm on spent dialysate samples at different times during dialysis session.