
Figure 6.
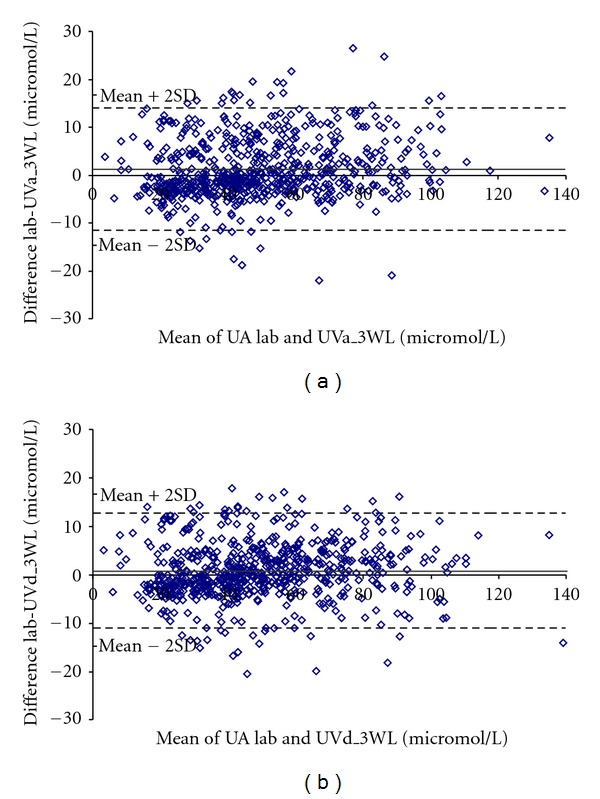
The Bland-Altman plots. (a) The difference between UA Lab and UVa_3WL is plotted against the mean value of UA Lab and UVa_3WL (N = 639). (b) The difference between UA Lab and UVd_3WL is plotted against the mean value of UA Lab and UVd_3WL (N = 639).