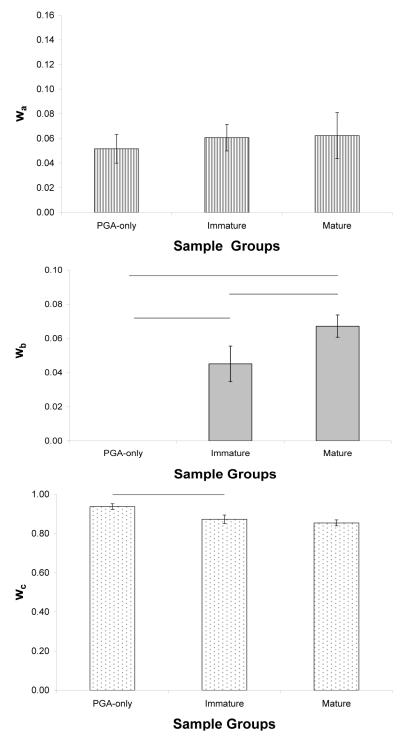
Figure 5.
Component weight fractions for empty PGA scaffolds, immature and mature engineered cartilage. A) There are no differences in wa between groups. B) wb was not detected in PGA scaffolds and showed an increase between immature and mature groups. C) There was a decrease in the bulk water fraction, wc, between PGA scaffolds and immature samples and a slight but insignificant decrease in wc between immature and mature samples. Horizontal bars indicate p < 0.05.

