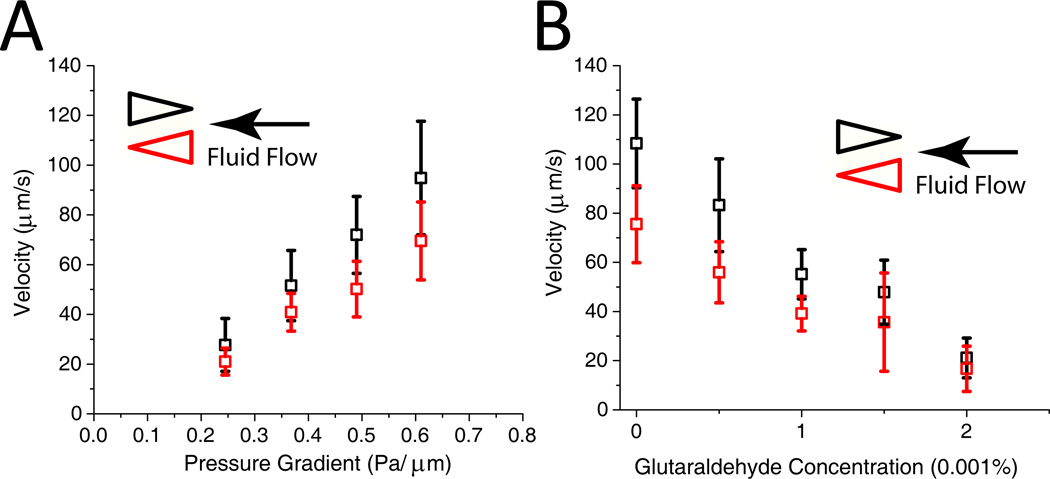
Figure 3.
A Velocity vs. pressure for RBCs moving through the two pore geometries. Error bars indicate standard deviation for each measurement. B. Velocity vs. glutaraldehyde concentration (v/v). RBCs were treated with the indicated concentration of glutaraldehyde for 30 minutes in PBS and then washed 3 times. The pressure difference/length was approximately 0.61 Pa/µm.

