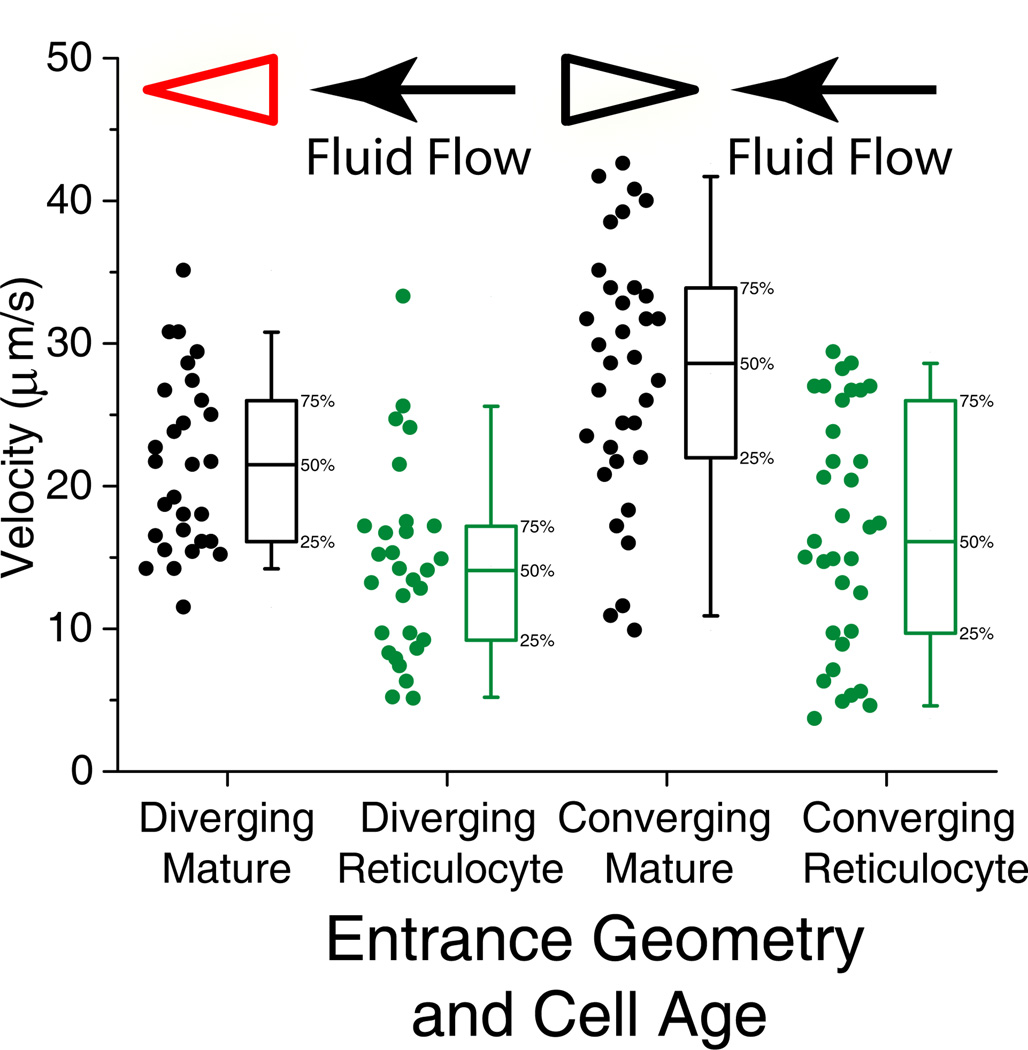
Figure 5.
Velocity vs. cell maturation state. All experiments were run simultaneously, at a pressure gradient of 0.24 Pa/µm. Whole blood RBCs was stained for nucleic acid content with thiazole orange. Cells homogeneously fluorescesing under the GFP filter set were identified as reticulocytes. For every reticulocyte that was identified and tracked for 200 µm, the next cell appearing in the field of view was also tracked.

