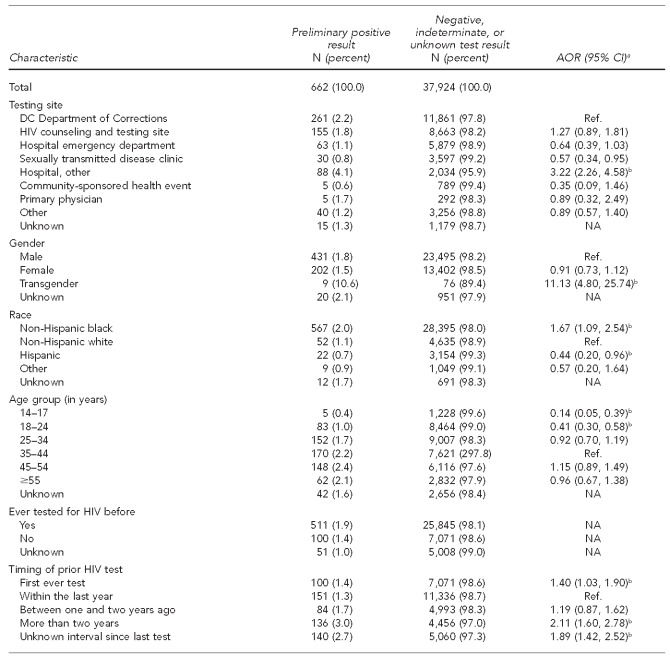
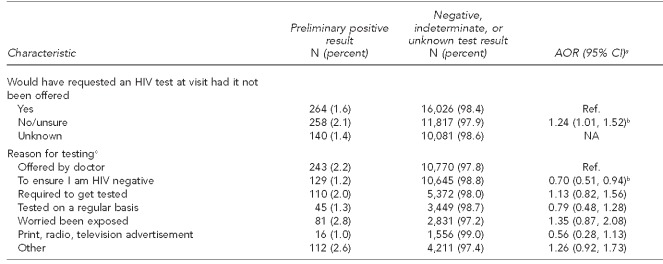
Table 2.
Characteristics of HIV testing campaign participants (n=38,586), by test result and adjusted odds of testing preliminary positive: Washington, DC, July 2006–September 2007
aAdjusted for all other variables in the model. Due to the large number of missing/unknown responses, these were excluded in the model as indicated by NA. Due to strong correlation between the “ever HIV tested” and “timing of prior HIV test” categories, the “ever HIV tested” category was also excluded from the adjusted model.
bp≤0.05
cParticipants were able to indicate more than one reason for getting tested.
HIV = human immunodeficiency virus
DC = District of Columbia
AOR = adjusted odds ratio
CI = confidence interval
Ref. = reference group
NA = not applicable


