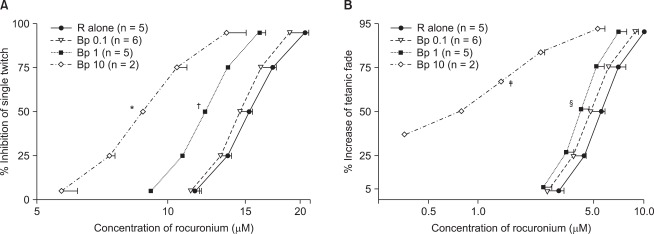
Fig. 2.
In view of the cumulative concentration-effect curves for rocuronium on a ST at 0.1 Hz (A) and TF at 50 Hz for 1.9 seconds (B), bupivacaine shifts curves to the left; hence, the drug augments the potency of rocuronium. Bupivacaine of 10 µM causes 36.8% increase of TF. The unit of concentrations for bupivacaine is µM. The scale of ordinate presents percentage, and that of abscissa, log (concentration). The values of concentration are mean ± SD. No SD bars are shown because they are within the symbol. Bp represents bupivacaine, and R, rocuronium. *, or ‡ indicates P < 0.05, vs all the rest groups, † indicates P < 0.05, vs R alone, or Bp 0.1, and § indicates P < 0.05, vs R alone.

