
Figure 3.
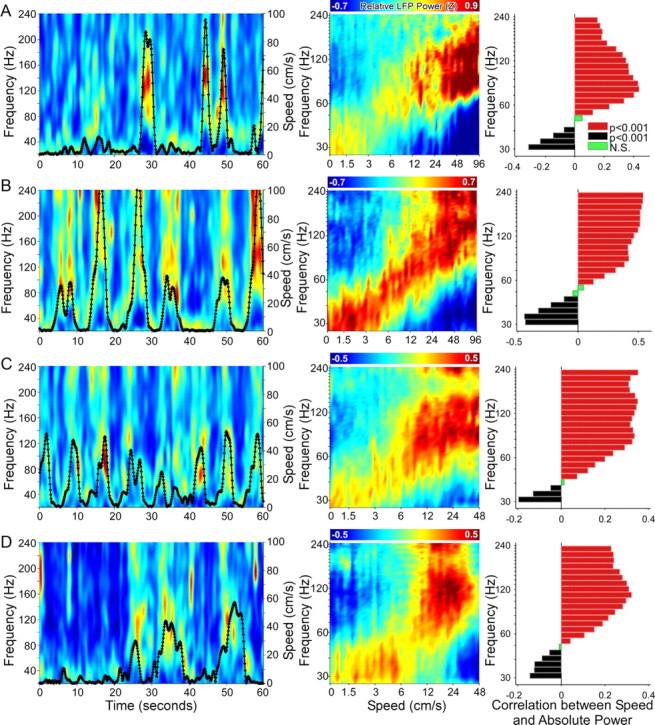
Additional examples showing increases in LFP gamma frequency as a function of increasing speed in four rats. A, Left, Spectrogram over a 60 s time period, showing the changes in relative power at each frequency as a rat ran freely on a Y-shaped track for an LFP recorded from the hippocampus. The rat's running speed is overlaid in black. Middle, For the same LFP, the relative power across the session is color coded as a function of both speed and frequency: power shifts to higher frequencies at faster running speeds. Right, For the same LFP, absolute power at lower gamma frequencies is negatively correlated with speed, whereas absolute power at higher gamma frequencies is positively correlated with speed. B, C, D, Data from single LFPs recorded from three other rats show similar increases in gamma frequency as a function of speed.