
Figure 5.
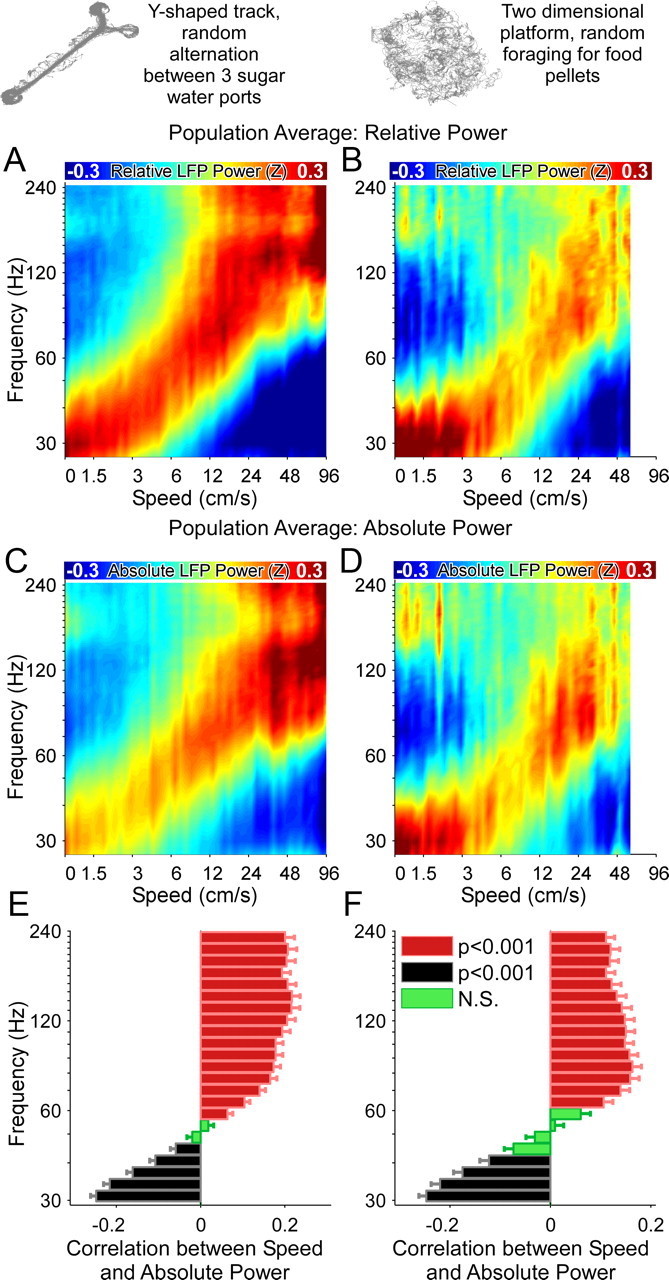
Population averages show that running speed changes the frequency of CA1 gamma oscillations on both linear and two-dimensional tracks. A, C, E, Population data from 74 LFPs recorded on Y-shaped tracks. B, D, F, Population data from 24 LFPs recorded on two-dimensional platforms. A, B, Color-coded population averages of relative power as a function of speed. C, D, Color-coded population averages of absolute power as a function of speed. Note the very similar relationships obtained using both relative and absolute measures of power. E, F, Low frequencies are negatively correlated, and high frequencies are positively correlated with running speed in each environment. All correlations are performed using absolute power measures. Thus the progressive frequency shift across the gamma-range is independent of the spatial environment.