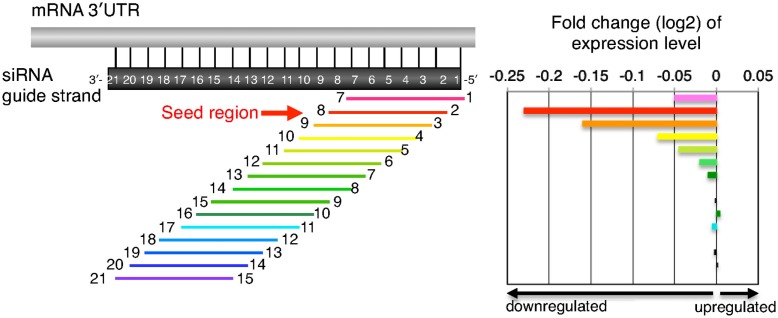
Figure 2.
Schematic presentation of downregulation of transcripts with seed-complementary sequences. In the left panel, transcripts possessing 3′UTR complementarity to a given 7-nt-long guide strand sequence were divided into 15 groups based on the position of the complementary sequence in the siRNA guide strand. Transcripts labeled with “1” and “7” at both ends possess complementarity to nucleotides 1–7 of the siRNA guide strand and vice versa. The horizontal arrow indicates a transcript group with seed complementarity. In the right panel, changes in gene expression levels are shown by log 2 of fold change ratio to mock transfection. Note that the groups of transcripts labeled with 2–8 are the most sensitive to the off-target effects, suggesting that guide strand nucleotides 2–8 serve as a “seed.”

