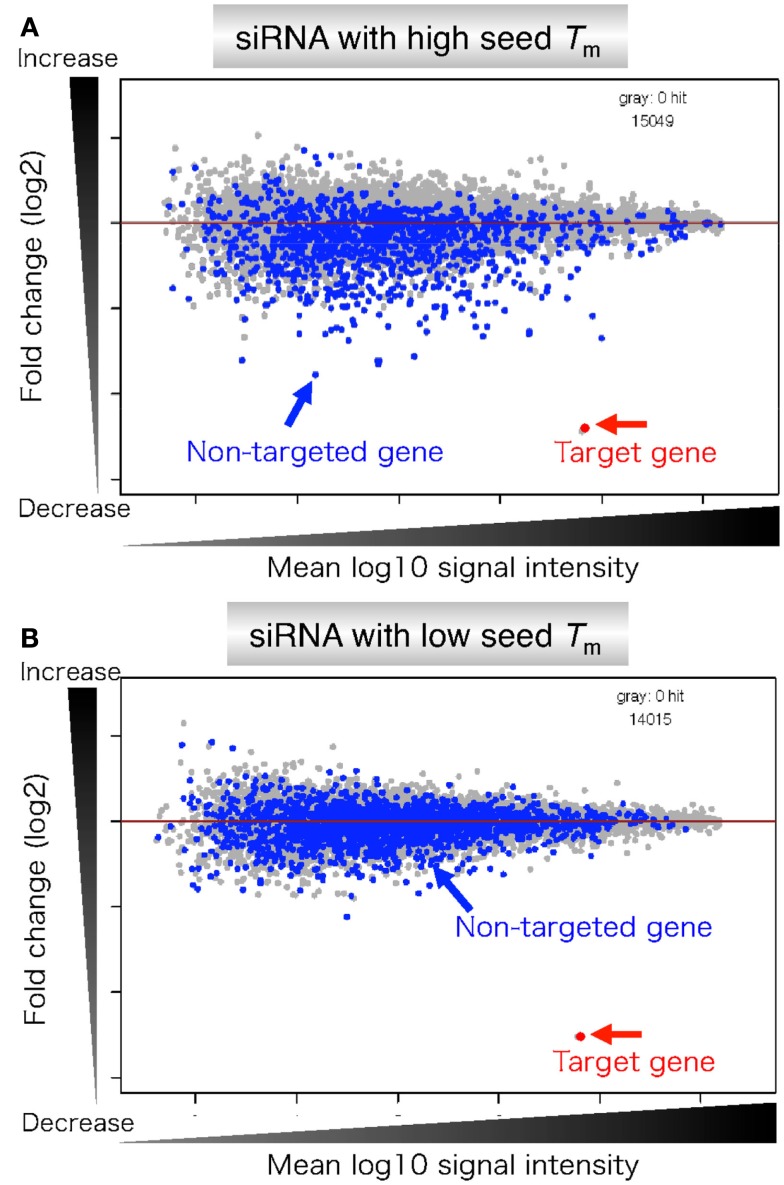
Figure 8.
Microarray profiles of transcripts downregulated by transfection of siRNA with high or low stability in the seed-target duplex. (A) siRNA with high seed Tm is capable of forming stable seed duplexes with the 3′ UTR counterpart of target mRNA. (B) siRNA with low seed Tm is capable of forming unstable seed duplexes with the 3′ UTR counterpart of target mRNA. Microarray-based expression profiles were examined 24 h after transfection. Gene expression changes are shown by log 2 of fold change ratio (ordinate) relative to mock transfection. The abscissa represents transcript signal intensity (log 10). Blue and gray dots represent transcripts complementary to the seed and those with no seed complementarity, respectively. Target genes are colored red and indicated by arrows. Their expression levels were similarly reduced. The number of genes examined is shown on the upper right edge of each panel.

