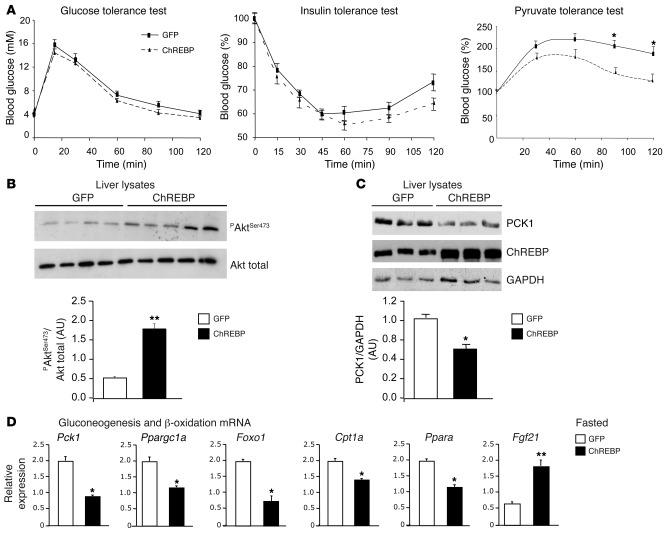
Figure 3. ChREBP-induced steatosis is not associated with insulin resistance.
(A) Glucose tolerance (1 g/kg), insulin tolerance (0.75 U/kg), and pyruvate tolerance (2 g/kg) tests were performed in GFP and ChREBP mice. *P < 0.05 ChREBP versus GFP mice. (B) Representative Western blot analysis of Ser473 phosphorylation in liver of fasted GFP and ChREBP mice. Quantification of the ratio of Ser473 Akt phosphorylation compared with total Akt protein content is shown. **P < 0.01 ChREBP versus GFP mice (n = 6–10 mice/group). (C) Total PCK1 and ChREBP protein content in liver lysates from overnight fasted GFP and ChREBP mice. GAPDH antibody was used as a loading control. A representative Western blot is shown (n = 6–8/group). Quantification of the ratio of PCK1 compared with GAPDH content is shown. *P < 0.05 ChREBP versus GFP mice (n = 6–10 mice/group). (D) qRT-PCR analysis of Pck1, Ppargc1a, Foxo1, Cpt1a, Ppara, and Fgf21 in livers from overnight fasted GFP and ChREBP mice. Results are the mean ± SEM (n = 6–8 mice/group). *P < 0.05, **P < 0.01 ChREBP versus GFP.

