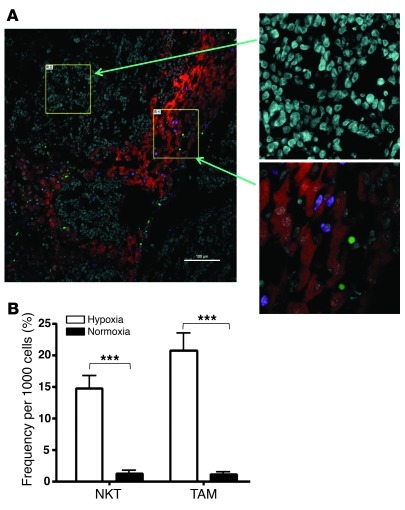
Figure 4. NKT cells preferentially localize to hypoxic areas within tumor tissues.
At 3 months after SCT, hu-NSG mice (see Methods) received i.v. injection of 106 CHLA-255/luc NB cells; 3 weeks later, mice were injected with CFSE-labeled NKT cells. For labeling hypoxic tissues, mice were i.v. injected with EF5 3 hours before being euthanized. (A) Immunofluorescent analysis of liver metastasis for hypoxia (Cy3–anti-EF5; red), NKT cells (CFSE; green), and human myeloid cells (hCD11b; violet). Magnified images (left, ×20; right, ×60) show typical areas of normoxic and hypoxic tissues. Shown are representative of 10 100-μm fields analyzed per mouse, 5 mice per experiment, 2 independent experiments. Scale bar: 100 μm. (B) Image analysis (see Methods). Regions with mean Cy3 intensity lower than 200 and higher than 550 were defined as normoxic and hypoxic, respectively. Absolute numbers of NKT cells and hCD11b+ cells in normoxic and hypoxic regions were counted in 10 100-μm fields per mouse, 5 mice per group. Shown are number of tumor-infiltrating NKT and CD11b+ cells per 1,000 cells (mean ± SD) in 1 of 2 experiments with similar results. ***P < 0.001.

