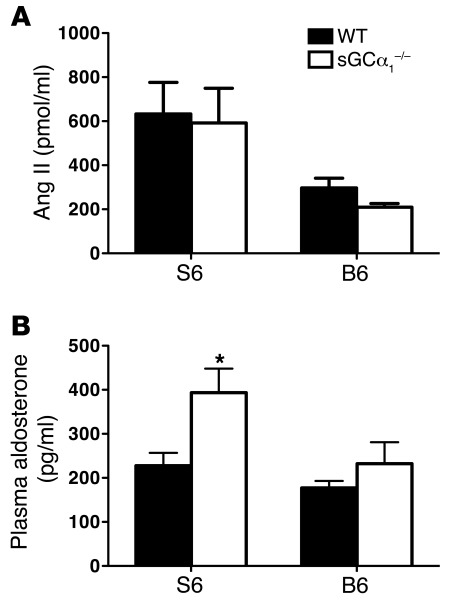
Figure 5. Activity of the RAAS is increased in sGCα1–/– mice on the S6 background.
(A) Ang II in plasma of male WT and sGCα1–/– mice on the B6 and on the S6 genetic background. n = 6–9. P < 0.01 for S6 versus B6 by 2-way ANOVA. (B) Plasma aldosterone levels in male WT and sGCα1–/– mice on the B6 and on the S6 genetic background. n = 11 for all groups. *P < 0.05 versus WTS6 by 2-way ANOVA.

