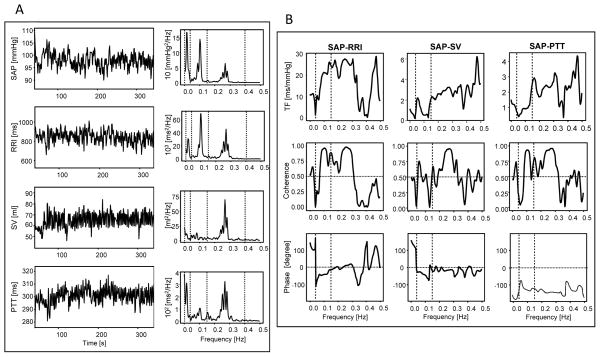
Figure 2.
Physiological data used to calculate HR-, SV-, and VT-BRS gain. (A) Systolic arterial pressure (SAP) as a measure of blood pressure (BP), R-to-R wave of the ECG (RRI), stroke volume (SV), and pulse transit time (PTT) recordings from one participant during the baseline (BL) task (left) and the corresponding spectra (right); (B) BP-RRI, BP-SV, and BP-PTT transfer functions (top panels), coherences (middle panels), and phases (lower panels).

