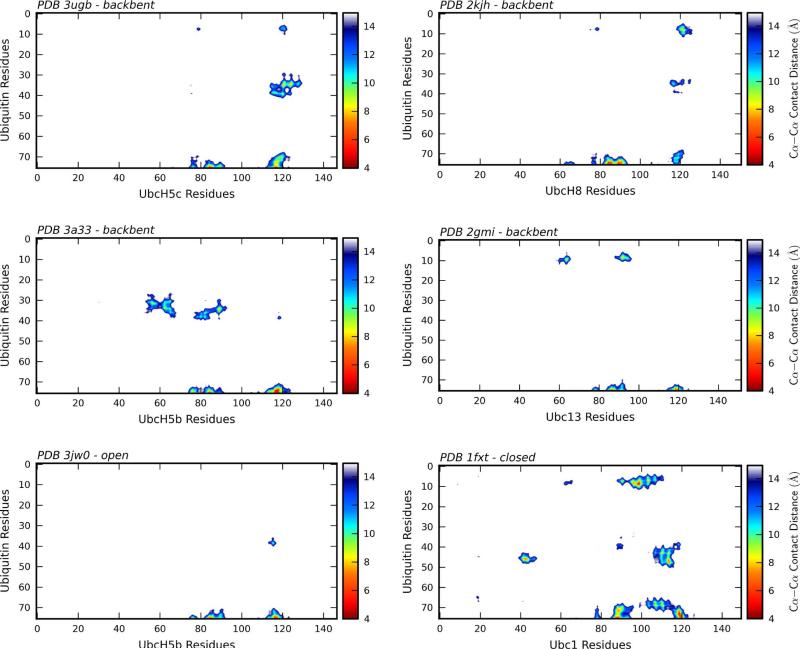
Figure 3.
Intra-conjugate Cα-Cα contact distance plots. Cα-Cα intra-conjugate contact distance plots for PDB 3ugb (UbcH5c~Ub), 3a33 (UbcH5b~Ub), PDB 3jw0 (UbcH5b~Ub + NEDD4L-HECT), 2gmi (Ubc13~Ub + Mms2), 2kjh (UbcH8-S-S-Ub) and 1fxt (Ubc1~Ub) indicate E2~Ub residue pairs separated by a distance 15 Å or less. For each structure Ub residues are shown on the y-axis and E2 residues are shown on the x-axis. A color bar associated with each plot indicates the Cα-Cα contact distance.

