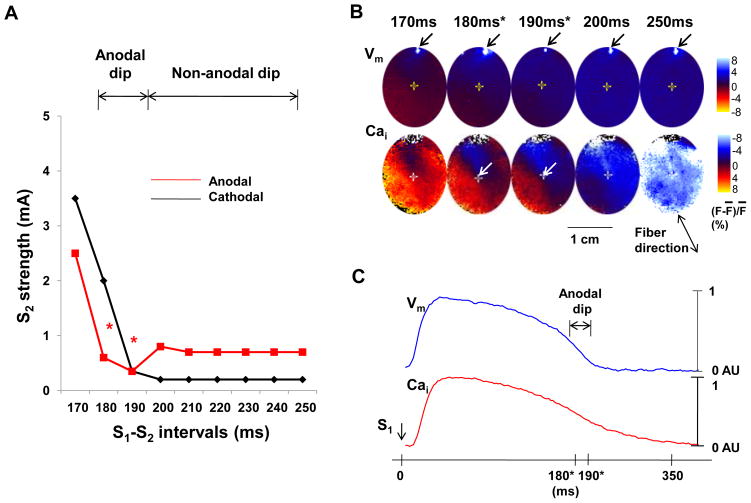
Figure 1.
Vm and Cai of the SI curve. A, SI curve of anodal and cathodal stimulation. The anodal threshold during anodal dip of 180–190 ms (asterisk) was lower than that of longer S1-S2 interval (non-anodal dip). B, Optical snapshots of Vm and Cai at the initiation of the S2. The S2 was located on the border zone between high (red) and low (blue) Cai during anodal dip (arrows). S1 induced planar wave propagated from the upper left to lower right. The S2 sites were indicated with the cross mark. The numbers above optical snapshots indicate the S1-S2 coupling interval. The white spot in each Vm snapshot was produced by the flash of a LED lamp used to document the timing of the S2. C, Vm and Cai tracings recorded at the S2 (the cross mark in B) during S1 pacing of 350ms. Note that the S2 occurred at the junction between red and blue areas during the anodal dip (180 ms and 190 ms), indicating that the anodal dip occurred at sites with rapidly changing Cai.

