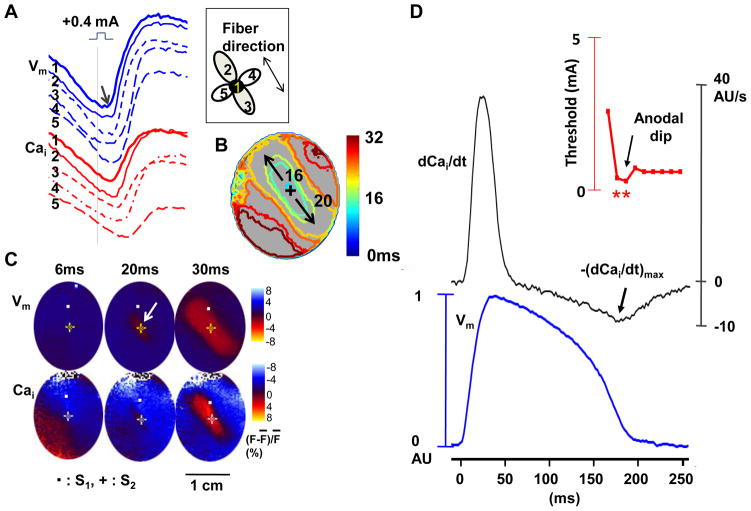
Figure 3.
The anodal-break excitation and role of Cai removal during anodal dip. A through C show a typical example of anode-break excitation originating from the stimulation site itself during anodal stimulus of 0.4 mA at the anodal dip period (S1-S2 interval of 190 ms). A, Vm and Cai tracings from S2 site (site 1) and surrounding 4 sites (sites 2–5). B, Vm isochronal map with times of activation (in ms) marked on selected isochrones, with the onset of S2 as time zero. C, Corresponding Vm and Cai fluorescence snapshots. Note that the excitation started from the site of S2 (arrow) and propagated faster along the fiber direction than across the fiber direction. D, The anodal SI curve (upper panel), dCai/dt (middle panel) and simultaneous Vm traces (lower panel) for S1-paced beats at the S2 site. The dCai/dt values were the highest during phase 1 and the lowest during the phase 3 of the action potential. –(dCai/dt)max (arrow) occurred when S1-S2 coupling interval was 180 ms, which was during the anodal dip on the SI curve.

