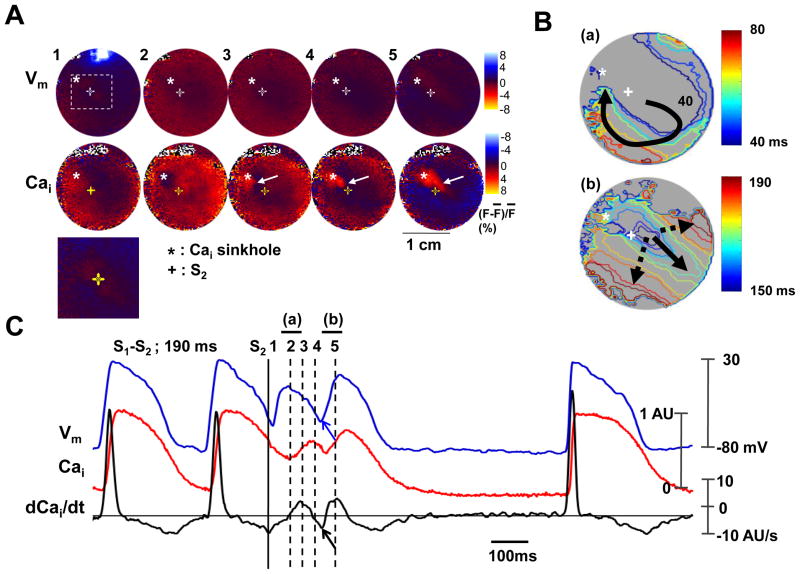
Figure 7.
The role of maximum Cai removal rate during repetitive beat. The 10 mA anodal S2 during the S1-S2 interval of 190 ms. A, Vm and Cai fluorescence snapshots. Note that Cai elevation starts from the Cai sinkhole (asterisks) and propagates slowly to other sites (arrow). Lower panel is the magnified image of boxed region. B, Vm isochronal map with times of activation (in ms) marked on selected isochrones, with the onset of S2 as time zero. C, Vm tracing, Cai tracing and dCai/dt recorded from the Cai sinkhole.

