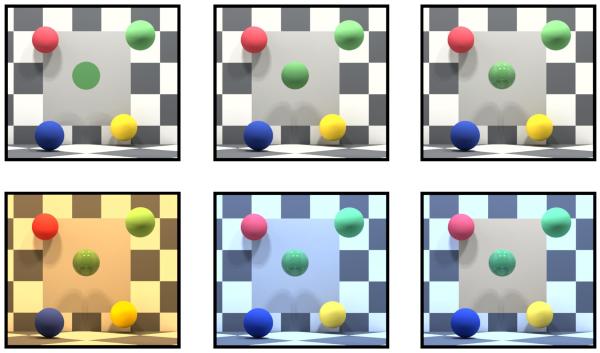
Figure 1.
Examples of experimental images. The three images in the top row show the experimental scene rendered using the Neutral illuminant. Across these three images, the test object varies. Left: matte disk; center: matte sphere; right: glossy sphere. The three images in the bottom row show the rendered scene for the Yellow illuminant consistent-cue condition (left), Blue illuminant consistent-cue condition (center), and Blue illuminant reduced-cue condition (right). The images shown in the figure were converted from the LMS cone representation to the sRGB color space for display. They were also tone mapped using an automated procedure that scaled each image so that its maximum luminance value was five times the image mean and then clipped out-of-range pixels. This tone mapping procedure differs from that applied to the experimental images and was used here for convenience.

